The U.S. State of Alaska currently has four statistical areas that have been delineated by the Office of Management and Budget (OMB). On July 21, 2023, the OMB delineated two metropolitan statistical areas and two micropolitan statistical areas in Alaska. [1] The most populous of these statistical areas is the Anchorage, AK Metropolitan Statistical Area, centered on the state's largest city of Anchorage.
The Office of Management and Budget (OMB) has designated more than 1,000 statistical areas for the United States and Puerto Rico. [2] These statistical areas are important geographic delineations of population clusters used by the OMB, the United States Census Bureau, planning organizations, and federal, state, and local government entities.
The OMB defines a core-based statistical area (commonly referred to as a CBSA) as the county or counties (or county-equivalents) surrounding at least one densely-settled core of at least 10,000 population, [2] "plus adjacent counties having a high degree of social and economic integration with the core as measured through commuting ties with the counties containing the core". [2] The OMB further divides core-based statistical areas based on population into metropolitan statistical areas (MSAs) for those with at least 50,000 and micropolitan statistical areas (μSAs) for those with 10,000 to 49,999 people. [2]
The OMB defines a combined statistical area (CSA) as two or more adjacent core-based statistical areas where the employment interchange rate (% commuting from A to B plus % commuting from B to A) is at least 15%. [2] The primary statistical areas (PSAs) include all combined statistical areas and any core-based statistical area that is not a constituent of a combined statistical area.
Primary statistical areas (PSAs) include all combined statistical areas and any core-based statistical area that is not a constituent of a combined statistical area. Of the four statistical areas of Alaska, all are PSAs comprising two metropolitan statistical areas and two micropolitan statistical areas.
| 2020 rank | Primary statistical area [1] | Population | ||||
|---|---|---|---|---|---|---|
| 2023 estimate [3] | Change | 2020 Census [4] | Change | 2010 Census [5] | ||
| 1 | Anchorage, AK MSA | 401,314 | +0.75% | 398,328 | +4.60% | 380,821 |
| 2 | Fairbanks-College, AK MSA | 94,840 | −0.85% | 95,655 | −1.97% | 97,581 |
| 3 | Juneau, AK μSA | 31,555 | −2.17% | 32,255 | +3.13% | 31,275 |
| 4 | Ketchikan, AK μSA | 13,738 | −1.51% | 13,948 | +3.49% | 13,477 |
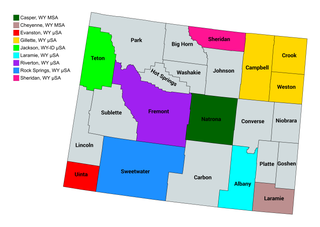
The U.S. State of Wyoming currently has ten statistical areas that have been delineated by the Office of Management and Budget (OMB). On July 21, 2023, the OMB delineated two metropolitan statistical areas and eight micropolitan statistical areas in Wyoming. The most populous of these statistical areas is the Cheyenne, WY Metropolitan Statistical Area with a 2020 Census population of 100,512.
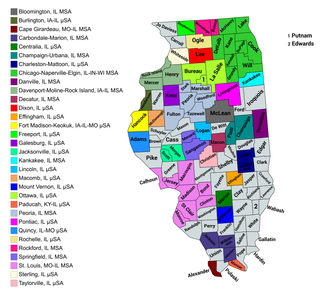
The U.S. State of Illinois currently has 43 statistical areas that have been delineated by the Office of Management and Budget (OMB). On March 6, 2020, the OMB delineated 11 combined statistical areas, 13 metropolitan statistical areas, and 19 micropolitan statistical areas in Illinois.
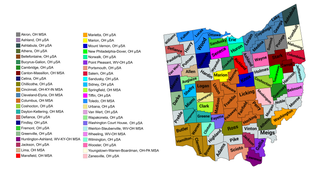
The U.S. State of Ohio currently has 55 statistical areas that have been delineated by the Office of Management and Budget (OMB). On July 21, 2023, the OMB delineated 11 combined statistical areas, 15 metropolitan statistical areas, and 29 micropolitan statistical areas in Ohio.
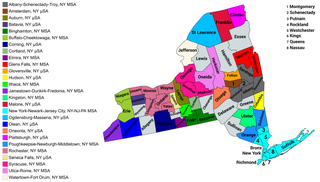
The U.S. state of New York currently has 34 statistical areas that have been delineated by the Office of Management and Budget (OMB). On March 6, 2020, the OMB delineated seven combined statistical areas, 14 metropolitan statistical areas, and 13 micropolitan statistical areas in New York.
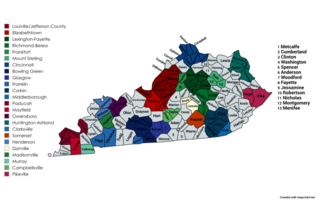
The United States Commonwealth of Kentucky currently has 32 statistical areas that have been delineated by the Office of Management and Budget (OMB). On March 6, 2020, the OMB delineated 8 combined statistical areas, 9 metropolitan statistical areas, and 15 micropolitan statistical areas in Kentucky.
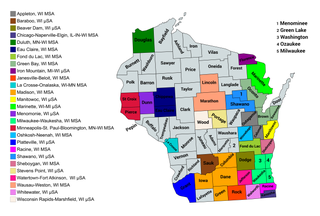
The U.S. State of Wisconsin currently has 36 statistical areas that have been delineated by the Office of Management and Budget (OMB). On March 6, 2020, the OMB delineated nine combined statistical areas, 15 metropolitan statistical areas, and 12 micropolitan statistical areas in Wisconsin.
The U.S. State of Arizona currently has 13 statistical areas that have been delineated by the Office of Management and Budget (OMB). On July 21, 2023, the OMB delineated two combined statistical areas, seven metropolitan statistical areas, and four micropolitan statistical areas in Arizona. As of 2023, the most populous of these is the Phoenix-Mesa, AZ Combined Statistical Area, encompassing the area around Arizona's capital and largest city, Phoenix.

The U.S. State of Montana currently has seven statistical areas that have been delineated by the Office of Management and Budget (OMB). On July 21, 2023, the OMB delineated five metropolitan statistical areas and two micropolitan statistical areas in Montana.
The U.S. State of Alabama currently has 34 statistical areas that have been delineated by the Office of Management and Budget (OMB).
The U.S. State of Arkansas currently has 25 statistical areas that have been delineated by the Office of Management and Budget (OMB). On July 21, 2023, the OMB delineated four combined statistical areas, seven metropolitan statistical areas, and 14 micropolitan statistical areas in Arkansas. As of 2023, the most populous statistical area in the state is Little Rock-North Little Rock, AR CSA, comprising the metro area of its capital and largest city, Little Rock.

The U.S. State of Delaware currently has four statistical areas that have been delineated by the Office of Management and Budget (OMB). On July 21, 2023, the OMB delineated one combined statistical area, two metropolitan statistical areas, and one micropolitan statistical area in Delaware.

The U.S. State of Kansas currently has 23 statistical areas that have been delineated by the Office of Management and Budget (OMB). On March 6, 2020, the OMB delineated three combined statistical areas, seven metropolitan statistical areas, and 13 micropolitan statistical areas in Kansas.
The U.S. State of Maryland currently has 12 statistical areas that have been delineated by the Office of Management and Budget (OMB). On March 6, 2020, the OMB delineated three combined statistical areas, seven metropolitan statistical areas, and two micropolitan statistical areas in Maryland.

The U.S. State of West Virginia currently has 20 statistical areas that have been delineated by the Office of Management and Budget (OMB). On July 21, 2023, the OMB delineated five combined statistical areas, 10 metropolitan statistical areas, and five micropolitan statistical areas in West Virginia.

The United States Commonwealth of Massachusetts currently has eight statistical areas that have been delineated by the Office of Management and Budget (OMB). On July 21, 2023, the OMB delineated two combined statistical area, seven metropolitan statistical areas, and three micropolitan statistical area in Massachusetts.
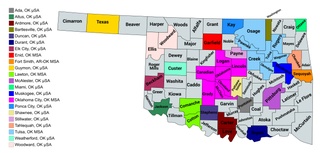
The U.S. State of Oklahoma currently has 26 statistical areas that have been delineated by the Office of Management and Budget (OMB). On March 6, 2020, the OMB delineated four combined statistical areas, five metropolitan statistical areas, and 17 micropolitan statistical areas in Oklahoma.
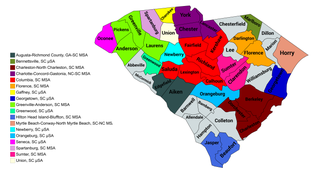
The U.S. State of South Carolina currently has 20 statistical areas that have been delineated by the Office of Management and Budget (OMB). On July 21, 2023, the OMB delineated four combined statistical areas, ten metropolitan statistical areas, and six micropolitan statistical areas in South Carolina.
The Commonwealth of Puerto Rico currently has 15 statistical areas that have been delineated by the United States Office of Management and Budget (OMB). On March 6, 2020, the OMB delineated three combined statistical areas, eight metropolitan statistical areas, and four micropolitan statistical areas in Puerto Rico.
The United States federal government defines and delineates the nation's metropolitan areas for statistical purposes, using a set of standard statistical area definitions. As of 2023, the U.S. Office of Management and Budget (OMB) defined and delineated 393 metropolitan statistical areas (MSAs) and 542 micropolitan statistical areas (μSAs) in the United States and Puerto Rico. Many of these 935 MSAs and μSAs are, in turn, components of larger combined statistical areas (CSAs) consisting of adjacent MSAs and μSAs that are linked by commuting ties; as of 2023, 582 metropolitan and micropolitan areas are components of the 184 defined CSAs. A collective term for MSAs, μSAs, and CSAs is primary statistical areas (PSAs), though that term is not used by OMB.
{{cite web}}: CS1 maint: multiple names: authors list (link)