Oregon statistical areas

Last updated
An enlargeable map of the 20 core-based statistical areas in Oregon. Oregon CBSAs 2020.png
An enlargeable map of the 20 core-based statistical areas in Oregon.

The U.S. State of Oregon currently has 24 statistical areas that have been delineated by the Office of Management and Budget (OMB). On March 6, 2020, the OMB delineated four combined statistical areas, eight metropolitan statistical areas, and 12 micropolitan statistical areas in Oregon. [1]

Contents

Statistical areas

The Office of Management and Budget (OMB) has designated more than 1,000 statistical areas for the United States and Puerto Rico. [2] These statistical areas are important geographic delineations of population clusters used by the OMB, the United States Census Bureau, planning organizations, and federal, state, and local government entities.

The OMB defines a core-based statistical area (commonly referred to as a CBSA) as "a statistical geographic entity consisting of the county or counties (or county-equivalents) associated with at least one core [lower-alpha 1] of at least 10,000 population, plus adjacent counties having a high degree of social and economic integration with the core as measured through commuting ties with the counties containing the core." [2] The OMB further divides core-based statistical areas into metropolitan statistical areas (MSAs) that have "a population of at least 50,000" and micropolitan statistical areas (μSAs) that have "a population of at least 10,000, but less than 50,000." [2]

The OMB defines a combined statistical area (CSA) as "a geographic entity consisting of two or more adjacent core-based statistical areas with employment interchange measures [lower-alpha 2] of at least 15%." [2] The primary statistical areas (PSAs) include all combined statistical areas and any core-based statistical area that is not a constituent of a combined statistical area.

Table

The table below describes the 24 United States statistical areas and 36 counties of the State of Oregon with the following information: [3]

  1. The combined statistical area (CSA) as designated by the OMB. [1]
  2. The CSA population according to 2019 US Census Bureau population estimates. [4]
  3. The core based statistical area (CBSA) [2] as designated by the OMB. [1]
  4. The CBSA population according to 2019 US Census Bureau population estimates [4]
  5. The county name
  6. The county population according to 2019 US Census Bureau population estimates [4]
The 24 United States statistical areas and 36 counties of the State of Oregon

Combined Statistical Area2019 PopulationCore Based Statistical Area2019 PopulationCounty2019 Population
Portland-Vancouver-Salem, OR-WA CSA 3,259,710
2,648,793
Portland-Vancouver-Hillsboro, OR-WA MSA 2,492,412
1,992,088
Multnomah County, Oregon 812,855
Washington County, Oregon 601,592
Clark County, Washington 488,241
Clackamas County, Oregon 418,187
Yamhill County, Oregon 107,100
Columbia County, Oregon 52,354
Skamania County, Washington 12,083
Salem, OR MSA 433,903 Marion County, Oregon 347,818
Polk County, Oregon 86,085
Albany-Lebanon, OR MSA 129,749 Linn County, Oregon 129,749
Longview, WA MSA 110,593 Cowlitz County, Washington 110,593
Corvallis, OR MSA 93,053 Benton County, Oregon 93,053
none Eugene-Springfield, OR MSA 382,067 Lane County, Oregon 382,067
Medford-Grants Pass, OR CSA 308,431 Medford, OR MSA 220,994 Jackson County, Oregon 220,994
Grants Pass, OR MSA 87,487 Josephine County, Oregon 87,487
none Bend, OR MSA 246,754 Deschutes County, Oregon 197,692
Jefferson County, Oregon 24,658
Crook County, Oregon 24,404
none Roseburg, OR μSA 110,980 Douglas County, Oregon 110,980
Hermiston-Pendleton, OR μSA 89,553 Umatilla County, Oregon 77,950
Morrow County, Oregon 11,603
Klamath Falls, OR μSA 68,238 Klamath County, Oregon 68,238
Coos Bay-North Bend, OR μSA 64,487 Coos County, Oregon 64,487
Newport, OR μSA 49,962 Lincoln County, Oregon 49,962
Astoria, OR μSA 40,224 Clatsop County, Oregon 40,244
Boise City-Mountain Home-Ontario, ID-OR CSA 831,235
30,571
Boise City-Nampa, ID MSA 749,202 Ada County, Idaho 481,587
Canyon County, Idaho 229,849
Gem County, Idaho 18,112
Owyhee County, Idaho 11,823
Boise County, Idaho 7,831
Ontario, OR-ID μSA 54,522
30,571
Malheur County, Oregon 30,571
Payette County, Idaho 23,951
Mountain Home, ID μSA 27,511 Elmore County, Idaho 27,511
none La Grande, OR μSA 26,835 Union County, Oregon 26,835
The Dalles, OR μSA 26,682 Wasco County, Oregon 26,682
Hood River, OR μSA 23,382 Hood River County, Oregon 23,382
Brookings, OR μSA 22,925 Curry County, Oregon 22,925
none Tillamook County, Oregon 27,036
Baker County, Oregon 16,124
Lake County, Oregon 7,869
Harney County, Oregon 7,393
Wallowa County, Oregon 7,208
Grant County, Oregon 7,199
Gilliam County, Oregon 1,912
Sherman County, Oregon 1,780
Wheeler County, Oregon 1,332
State of Oregon 4,217,737

See also

Notes

  1. The OMB defines a core as "a densely settled concentration of population, comprising an Urban Area (of 10,000 or more population) delineated by the Census Bureau, around which a core-based statistical area is delineated." [2]
  2. The OMB defines the employment interchange measure as "the sum of the percentage of workers living in the smaller entity who work in the larger entity plus the percentage of employment in the smaller entity that is accounted for by workers who reside in the larger entity." [2]

Related Research Articles

<span class="mw-page-title-main">Indiana statistical areas</span> Indiana statistical areas

The U.S. state of Indiana currently has 51 statistical areas that have been delineated by the Office of Management and Budget (OMB). On March 6, 2020, the OMB delineated ten combined statistical areas, 15 metropolitan statistical areas, and 26 micropolitan statistical areas in Indiana.

<span class="mw-page-title-main">Illinois statistical areas</span> Illinois statistical areas

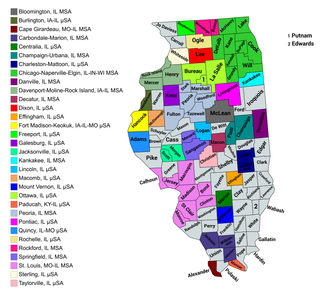
The U.S. State of Illinois currently has 43 statistical areas that have been delineated by the Office of Management and Budget (OMB). On March 6, 2020, the OMB delineated 11 combined statistical areas, 13 metropolitan statistical areas, and 19 micropolitan statistical areas in Illinois.

<span class="mw-page-title-main">Ohio statistical areas</span> Ohio statistical areas

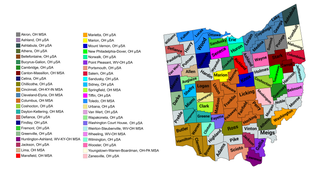
The U.S. State of Ohio currently has 55 statistical areas that have been delineated by the Office of Management and Budget (OMB). On July 21, 2023, the OMB delineated 11 combined statistical areas, 15 metropolitan statistical areas, and 29 micropolitan statistical areas in Ohio.

<span class="mw-page-title-main">New York statistical areas</span>

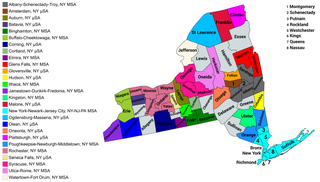
The U.S. state of New York currently has 34 statistical areas that have been delineated by the Office of Management and Budget (OMB). On March 6, 2020, the OMB delineated seven combined statistical areas, 14 metropolitan statistical areas, and 13 micropolitan statistical areas in New York.

<span class="mw-page-title-main">Wisconsin statistical areas</span> Wisconsin statistical areas

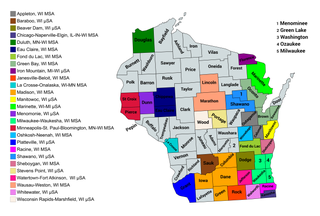
The U.S. State of Wisconsin currently has 36 statistical areas that have been delineated by the Office of Management and Budget (OMB). On March 6, 2020, the OMB delineated nine combined statistical areas, 15 metropolitan statistical areas, and 12 micropolitan statistical areas in Wisconsin.

<span class="mw-page-title-main">Montana statistical areas</span> Montana statistical areas

The U.S. State of Montana currently has seven statistical areas that have been delineated by the Office of Management and Budget (OMB). On July 21, 2023, the OMB delineated five metropolitan statistical areas and two micropolitan statistical areas in Montana.

<span class="mw-page-title-main">California statistical areas</span> California statistical areas

The U.S. State of California currently has 39 statistical areas that have been delineated by the federal Office of Management and Budget (OMB). On March 6, 2020, the OMB delineated five combined statistical areas, 26 metropolitan statistical areas, and eight micropolitan statistical areas in California.

<span class="mw-page-title-main">Alabama statistical areas</span> Alabama statistical areas

The U.S. State of Alabama currently has 37 statistical areas that have been delineated by the Office of Management and Budget (OMB). On July 21, 2023, the OMB delineated 9 combined statistical areas, 15 metropolitan statistical areas, and 13 micropolitan statistical areas in Alabama.

<span class="mw-page-title-main">Iowa statistical areas</span> Iowa statistical areas

The U.S. State of Iowa currently has 30 statistical areas that have been delineated by the Office of Management and Budget (OMB). On March 6, 2020, the OMB delineated six combined statistical areas, nine metropolitan statistical areas, and 15 micropolitan statistical areas in Iowa.

<span class="mw-page-title-main">Kansas statistical areas</span> Kansas statistical areas

The U.S. State of Kansas currently has 23 statistical areas that have been delineated by the Office of Management and Budget (OMB). On March 6, 2020, the OMB delineated three combined statistical areas, seven metropolitan statistical areas, and 13 micropolitan statistical areas in Kansas.

The U.S. State of Maryland currently has 12 statistical areas that have been delineated by the Office of Management and Budget (OMB). On March 6, 2020, the OMB delineated three combined statistical areas, seven metropolitan statistical areas, and two micropolitan statistical areas in Maryland.

<span class="mw-page-title-main">West Virginia statistical areas</span> West Virginia statistical areas

The U.S. State of West Virginia currently has 20 statistical areas that have been delineated by the Office of Management and Budget (OMB). On July 21, 2023, the OMB delineated five combined statistical areas, 10 metropolitan statistical areas, and five micropolitan statistical areas in West Virginia.

<span class="mw-page-title-main">Louisiana statistical areas</span> Louisiana statistical areas

The U.S. State of Louisiana currently has 25 statistical areas that have been delineated by the Office of Management and Budget (OMB). On July 21, 2023, the OMB delineated six combined statistical areas, ten metropolitan statistical areas, and nine micropolitan statistical areas in Louisiana.

<span class="mw-page-title-main">Maine statistical areas</span> Maine statistical areas

The U.S. State of Maine currently has five statistical areas that have been delineated by the Office of Management and Budget (OMB). On July 21, 2023, the OMB delineated one combined statistical area, three metropolitan statistical areas, and one micropolitan statistical area in Maine.

<span class="mw-page-title-main">New Hampshire statistical areas</span> New Hampshire statistical areas

The U.S. State of New Hampshire currently has eight statistical areas that have been delineated by the Office of Management and Budget (OMB). On July 21, 2023, the OMB delineated two combined statistical areas, two metropolitan statistical areas, and four micropolitan statistical areas in New Hampshire.

<span class="mw-page-title-main">New Mexico statistical areas</span> New Mexico statistical areas

The U.S. State of New Mexico currently has 19 statistical areas that have been delineated by the Office of Management and Budget (OMB). On July 21, 2023, the OMB delineated two combined statistical areas, four metropolitan statistical areas, and 13 micropolitan statistical areas in New Mexico.

<span class="mw-page-title-main">Oklahoma statistical areas</span>

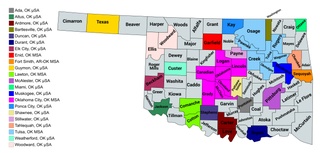
The U.S. State of Oklahoma currently has 26 statistical areas that have been delineated by the Office of Management and Budget (OMB). On March 6, 2020, the OMB delineated four combined statistical areas, five metropolitan statistical areas, and 17 micropolitan statistical areas in Oklahoma.

<span class="mw-page-title-main">South Carolina statistical areas</span> South Carolina statistical areas

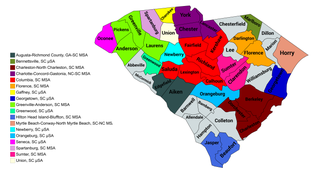
The U.S. State of South Carolina currently has 20 statistical areas that have been delineated by the Office of Management and Budget (OMB). On July 21, 2023, the OMB delineated four combined statistical areas, ten metropolitan statistical areas, and six micropolitan statistical areas in South Carolina.

<span class="mw-page-title-main">South Dakota statistical areas</span> South Dakota statistical areas

The U.S. State of South Dakota currently has 14 statistical areas that have been delineated by the Office of Management and Budget (OMB). On July 21, 2023, the OMB delineated two combined statistical areas, three metropolitan statistical areas, and nine micropolitan statistical areas in South Dakota.

<span class="mw-page-title-main">Vermont statistical areas</span> Vermont statistical areas

The U.S. State of Vermont currently has six statistical areas that have been delineated by the Office of Management and Budget (OMB). On July 21, 2023, the OMB delineated two combined statistical areas, one metropolitan statistical area, and five micropolitan statistical areas in Vermont.

References

  1. 1 2 3 4 Revised Delineations of Metropolitan Statistical Areas, Micropolitan Statistical Areas, and Combined Statistical Areas, and Guidance on Uses of the Delineations of These Areas (March 6, 2020). "0MB BULLETIN NO. 20-01" (PDF). Office of Management and Budget . Retrieved December 15, 2021.{{cite web}}: CS1 maint: multiple names: authors list (link)
  2. 1 2 3 4 5 6 7 "2020 Standards for Delineating Core Based Statistical Areas". Office of Management and Budget. July 16, 2021. Retrieved December 15, 2021.
  3. An out-of-state area and its population are displayed in green.An area that extends into more than one state is displayed in teal. A teal population number over a black population number show the total population versus the in-state population.
  4. 1 2 3 "Annual Estimates of the Resident Population for Counties in the United States: April 1, 2010 to July 1, 2019". United States Census Bureau, Population Division. April 2020. Retrieved April 9, 2020.

43°56′01″N120°33′30″W / 43.9336°N 120.5583°W / 43.9336; -120.5583 (State of Oregon)