California's 7th congressional district | |||
---|---|---|---|
Representative |
| ||
Population (2022) | 763,060 | ||
Median household income | $85,158 [1] | ||
Ethnicity |
| ||
Cook PVI | D+17 [2] |
California's 7th congressional district is a United States congressional district in California. Doris Matsui, a Democrat, has represented the district since January 2023.
Currently, it encompasses southern Sacramento County, part of Yolo County, and a tiny portion of Solano County. It includes all of Sacramento south of the American River, including Downtown Sacramento, and its suburbs of West Sacramento, Elk Grove, and Galt. It is a heavily Democratic district. [3] Prior to redistricting in 2021, it was entirely in Sacramento County and included the eastern and southern suburbs of Sacramento.
Containing most of the state capital of Sacramento, the 7th is currently a solidly Democratic district with a D+17 rating from the Cook Partisan Voting Index.
Registered voter statistics comes from the California Secretary of State:
Political Party | Registered Voter Percentage |
---|---|
American Independent | 3.20 |
Democratic | 38.99 |
Green | 0.43 |
Libertarian | 0.95 |
No Party Preference | 22.33 |
Other | 0.18 |
Peace and Freedom | 0.47 |
Republican | 33.45 |
Year | Office | Results |
---|---|---|
1992 | President | Clinton 60.8 - 22.3% |
Senator | Boxer 63.2 - 27.4% | |
Senator | Feinstein 70.0 - 23.7% | |
1994 | Governor | [ data missing ] |
Senator | [ data missing ] | |
1996 | President | [ data missing ] |
1998 | Governor | [ data missing ] |
Senator | [ data missing ] | |
2000 | President [4] | Gore 68.7 - 26.8% |
Senator [5] | Feinstein 69.0 - 24.4% | |
2002 | Governor [6] | Davis 59.7 - 29.1% |
2003 | Recall [7] [8] | No 60.8 - 39.2% |
Bustamante 44.3 - 34.5% | ||
2004 | President [9] | Kerry 67.1 - 31.8% |
Senator [10] | Boxer 69.3 - 26.9% | |
2006 | Governor [11] | Angelides 50.4 - 44.0% |
Senator [12] | Feinstein 71.0 - 23.6% | |
2008 | President [13] | Obama 71.4 - 26.4% |
2010 | Governor | Brown 67.1 - 28.3% |
Senator | Boxer 65.4 - 29.4% | |
2012 | President [14] | Obama 50.8 - 46.8% |
Senator | Feinstein 53.5 - 46.5% | |
2014 | Governor | Brown 56.2 - 43.8% |
2016 | President | Clinton 52.3 - 40.9% |
Senator | Harris 65.3 - 34.7% | |
2018 | Governor | Newsom 52.0 - 48.0% |
Senator | Feinstein 50.7 - 49.3% | |
2020 | President | Biden 55.6 - 41.9% |
2021 | Recall [15] | No 54% - 46% |
2022 | Governor [16] | Newsom 63.8 - 36.2% |
Senator | Padilla 66.1 - 33.9% |
# | County | Seat | Population |
---|---|---|---|
67 | Sacramento | Sacramento | 1,588,921 |
As of 2023, California's 7th congressional district is located in the Sacramento Valley, and encompasses most of Sacramento County and parts of Yolo.
Sacramento County is split between this district and both the 3rd district and 6th district. The 7th and 3rd districts are partitioned by Latrobe Rd. The 7th and 6th districts are partitioned by the Sacramento River, American River, Fair Oaks Blvd, Watt Ave, Kiefer Blvd, Highway 16, Bradshaw Rd, Highway E2, and Stonehouse Dr. The 7th district takes in the south side of the city of Sacramento, the cities of Galt and Elk Grove, and the census-designated places Florin and Parkway.
Yolo County is split between this district and 4th district. They are partitioned by Highway 84 and Elkhorn Slough on the southern border, and by County Rd 126, Tule Canal, Toe Drain Canal, Highway 84, Babel Slough Rd, and Pumphouse Rd. The 7th district takes in the city of West Sacramento, and most of Ryer Island.
1892 • 1894 • 1896 • 1898 • 1900 • 1902 • 1904 • 1906 • 1908 • 1910 • 1912 • 1914 • 1916 • 1918 • 1920 • 1922 • 1924 • 1926 • 1928 • 1930 • 1932 • 1934 • 1936 • 1938 • 1940 • 1942 • 1944 • 1946 • 1948 • 1950 • 1952 • 1954 • 1956 • 1958 • 1960 • 1962 • 1964 • 1966 • 1968 • 1970 • 1972 • 1974 • 1976 • 1978 • 1980 • 1982 • 1984 • 1986 • 1988 • 1990 • 1992 • 1994 • 1996 • 1998 • 2000 • 2002 • 2004 • 2006 • 2008 • 2010 • 2012 • 2014 • 2016 • 2018 • 2020 • 2022 |
Party | Candidate | Votes | % | |
---|---|---|---|---|
Republican | William W. Bowers (inc.) | 15,856 | 41.6 | |
Democratic | Olin Welborn | 14,869 | 39.0 | |
Populist | Hiram Hamilton | 5,578 | 14.6 | |
Prohibition | M. B. Harris | 1,844 | 4.8 | |
Total votes | 38,147 | 100.0 | ||
Turnout | {{{votes}}} | |||
Republican hold | ||||
Party | Candidate | Votes | % | |
---|---|---|---|---|
Republican | William W. Bowers (inc.) | 18,434 | 42.9 | |
Democratic | W. H. Alford | 12,111 | 28.2 | |
Populist | J. L. Gilbert | 10,719 | 25.0 | |
Prohibition | W. H. Somers | 1,669 | 3.9 | |
Total votes | 42,933 | 100.0 | ||
Turnout | {{{votes}}} | |||
Republican hold | ||||
Party | Candidate | Votes | % | |||
---|---|---|---|---|---|---|
Populist | Curtis H. Castle | 19,183 | 46.7 | |||
Republican | William W. Bowers (inc.) | 18,939 | 46.1 | |||
Independent | William H. "Billy" Carlson | 2,139 | 5.2 | |||
Prohibition | James W. Webb | 802 | 2.0 | |||
Total votes | 41,063 | 100.0 | ||||
Turnout | {{{votes}}} | |||||
Populist gain from Republican | ||||||
Party | Candidate | Votes | % | |||
---|---|---|---|---|---|---|
Republican | James C. Needham | 20,793 | 50.1 | |||
Populist | Curtis H. Castle (incumbent) | 20,680 | 49.9 | |||
Total votes | 41,473 | 100.0 | ||||
Turnout | {{{votes}}} | |||||
Republican gain from Populist | ||||||
Party | Candidate | Votes | % | |
---|---|---|---|---|
Republican | James C. Needham (inc.) | 23,450 | 52.4 | |
Democratic | W. D. Crichton | 18,981 | 42.4 | |
Socialist | Noble A. Richardson | 1,385 | 3.1 | |
Prohibition | A. H. Hensley | 919 | 2.1 | |
Total votes | 44,735 | 100.0 | ||
Turnout | {{{votes}}} | |||
Republican hold | ||||
Party | Candidate | Votes | % | |
---|---|---|---|---|
Republican | James McLachlan (inc.) | 19,407 | 64.8 | |
Democratic | Carl A. Johnson | 8,075 | 27.0 | |
Socialist | George H. Hewes | 1,261 | 4.2 | |
Prohibition | Frederick F. Wheeler | 1,195 | 4.0 | |
Total votes | 30,638 | 100.0 | ||
Turnout | {{{votes}}} | |||
Republican hold | ||||
Party | Candidate | Votes | % | |
---|---|---|---|---|
Republican | James McLachlan (inc.) | 31,091 | 64.2 | |
Democratic | W. O. Morton | 11,259 | 23.3 | |
Socialist | F. I. Wheat | 3,594 | 7.4 | |
Prohibition | John Sobieski | 2,467 | 5.1 | |
Total votes | 48,411 | 100.0 | ||
Turnout | {{{votes}}} | |||
Republican hold | ||||
Party | Candidate | Votes | % | |
---|---|---|---|---|
Republican | James McLachlan (inc.) | 22,338 | 56.8 | |
Democratic | Robert G. Laucks | 11,197 | 28.4 | |
Socialist | Claude Riddle | 3,641 | 9.2 | |
Prohibition | Levi D. Johnson | 2,189 | 5.6 | |
Total votes | 39,365 | 100.0 | ||
Turnout | {{{votes}}} | |||
Republican hold | ||||
Party | Candidate | Votes | % | |
---|---|---|---|---|
Republican | James McLachlan (inc.) | 37,244 | 51.9 | |
Democratic | Jud R. Rush | 25,445 | 35.4 | |
Socialist | A. R. Holston | 4,432 | 6.2 | |
Prohibition | Marshall W. Atwood | 3,899 | 5.4 | |
Independence | F. G. Hentig | 791 | 1.1 | |
Total votes | 71,811 | 100.0 | ||
Turnout | {{{votes}}} | |||
Republican hold | ||||
Party | Candidate | Votes | % | |
---|---|---|---|---|
Republican | William Stephens (incumbent) | 36,435 | 58.7 | |
Democratic | Lorin A. Handley | 13,340 | 21.5 | |
Socialist | Thomas V. Williams | 10,305 | 16.6 | |
Prohibition | C. V. LeFontaine | 1,990 | 3.2 | |
Total votes | 62,070 | 100.0 | ||
Turnout | {{{votes}}} | |||
Republican hold | ||||
Party | Candidate | Votes | % | |
---|---|---|---|---|
Democratic | Denver S. Church (inc.) | 23,752 | 44.0 | |
Republican | James C. Needham | 22,994 | 42.7 | |
Socialist | J. S. Cato | 7,171 | 13.3 | |
Total votes | 53,917 | 100.0 | ||
Turnout | {{{votes}}} | |||
Democratic hold | ||||
Party | Candidate | Votes | % | |
---|---|---|---|---|
Democratic | Denver S. Church (inc.) | 39,389 | 49.9 | |
Republican | A. M. Drew | 25,106 | 31.8 | |
Socialist | Harry M. McKee | 7,797 | 9.9 | |
Prohibition | Don A. Allen | 6,573 | 8.3 | |
Total votes | 78,865 | 100.0 | ||
Turnout | {{{votes}}} | |||
Democratic hold | ||||
Party | Candidate | Votes | % | |
---|---|---|---|---|
Democratic | Denver S. Church (inc.) | 38,787 | 51.0 | |
Republican | W. W. Phillips | 27,676 | 36.4 | |
Socialist | Harry M. McKee | 5,492 | 7.2 | |
Prohibition | J. F. Butler | 4,042 | 5.3 | |
Total votes | 75,997 | 100.0 | ||
Turnout | {{{votes}}} | |||
Democratic hold | ||||
Party | Candidate | Votes | % | |||
---|---|---|---|---|---|---|
Republican | Henry E. Barbour | 33,476 | 52.1 | |||
Democratic | Henry Hawson | 30,745 | 47.9 | |||
Total votes | 64,221 | 100.0 | ||||
Turnout | {{{votes}}} | |||||
Republican gain from Democratic | ||||||
Party | Candidate | Votes | % | |
---|---|---|---|---|
Republican | Henry E. Barbour (incumbent) | 57,647 | 87.2 | |
Socialist | Harry M. McKee | 8,449 | 12.8 | |
Total votes | 66,096 | 100.0 | ||
Turnout | {{{votes}}} | |||
Republican hold | ||||
Party | Candidate | Votes | % | |
---|---|---|---|---|
Republican | Henry E. Barbour (incumbent) | 67,000 | 100.0 | |
Turnout | {{{votes}}} | |||
Republican hold | ||||
Party | Candidate | Votes | % | |
---|---|---|---|---|
Republican | Henry E. Barbour (incumbent) | 65,740 | 100.0 | |
Turnout | {{{votes}}} | |||
Republican hold | ||||
Party | Candidate | Votes | % | |
---|---|---|---|---|
Republican | Henry E. Barbour (incumbent) | 73,271 | 100.0 | |
Turnout | {{{votes}}} | |||
Republican hold | ||||
Party | Candidate | Votes | % | |
---|---|---|---|---|
Republican | Henry E. Barbour (incumbent) | 71,195 | 100.0 | |
Turnout | {{{votes}}} | |||
Republican hold | ||||
Party | Candidate | Votes | % | |
---|---|---|---|---|
Republican | Henry E. Barbour (incumbent) | 79,041 | 100.0 | |
Turnout | {{{votes}}} | |||
Republican hold | ||||
Party | Candidate | Votes | % | ||
---|---|---|---|---|---|
Republican | Ralph R. Eltse | 45,944 | 45.5 | ||
Democratic | Frank V. Cornish | 32,365 | 32.0 | ||
Socialist | J. Stitt Wilson | 22,767 | 22.5 | ||
Total votes | 101,076 | 100.0 | |||
Turnout | {{{votes}}} | ||||
Republican win (new seat) |
Party | Candidate | Votes | % | |||
---|---|---|---|---|---|---|
Democratic | John H. Tolan | 51,962 | 52.3 | |||
Republican | Ralph R. Eltse (incumbent) | 47,414 | 47.7 | |||
Total votes | 99,376 | 100.0 | ||||
Turnout | {{{votes}}} | |||||
Democratic gain from Republican | ||||||
Party | Candidate | Votes | % | |
---|---|---|---|---|
Democratic | John H. Tolan (incumbent) | 69,463 | 59.8 | |
Republican | Charles W. Fisher | 46,647 | 40.2 | |
Total votes | 116,110 | 100.0 | ||
Turnout | {{{votes}}} | |||
Democratic hold | ||||
Party | Candidate | Votes | % | |
---|---|---|---|---|
Democratic | John H. Tolan (incumbent) | 62,599 | 55.3 | |
Republican | Charles W. Fisher | 50,504 | 44.7 | |
Total votes | 113,103 | 100.0 | ||
Turnout | {{{votes}}} | |||
Democratic hold | ||||
Party | Candidate | Votes | % | |
---|---|---|---|---|
Democratic | John H. Tolan (incumbent) | 72,838 | 55.5 | |
Republican | Ralph R. Eltse | 56,808 | 43.2 | |
Communist | Alfred N. Johnson | 1,707 | 1.3 | |
Total votes | 131,353 | 100.0 | ||
Turnout | {{{votes}}} | |||
Democratic hold | ||||
Party | Candidate | Votes | % | |
---|---|---|---|---|
Democratic | John H. Tolan (incumbent) | 77,292 | 100.0 | |
Turnout | {{{votes}}} | |||
Democratic hold | ||||
Party | Candidate | Votes | % | |||
---|---|---|---|---|---|---|
Democratic | John H. Tolan (incumbent) | 81,762 | 57.9 | |||
Republican | Chelsey M. Walter | 59,360 | 42.1 | |||
Total votes | 141,122 | 100.0 | ||||
Turnout | {{{votes}}} | |||||
Democratic gain from Republican | ||||||
Party | Candidate | Votes | % | |||
---|---|---|---|---|---|---|
Republican | John J. Allen, Jr. | 61,508 | 56.2 | |||
Democratic | Patrick W. McDonough | 47,988 | 43.8 | |||
Total votes | 109,496 | 100.0 | ||||
Turnout | {{{votes}}} | |||||
Republican gain from Democratic | ||||||
Party | Candidate | Votes | % | |
---|---|---|---|---|
Republican | John J. Allen, Jr. (incumbent) | 78,534 | 51.4 | |
Democratic | Buell G. Gallagher | 74,318 | 48.6 | |
Total votes | 152,852 | 100.0 | ||
Turnout | {{{votes}}} | |||
Republican hold | ||||
Party | Candidate | Votes | % | |
---|---|---|---|---|
Republican | John J. Allen, Jr. (incumbent) | 74,069 | 55.3 | |
Democratic | Lyle E. Cook | 59,976 | 44.7 | |
Total votes | 134,045 | 100.0 | ||
Turnout | {{{votes}}} | |||
Republican hold | ||||
Party | Candidate | Votes | % | |
---|---|---|---|---|
Republican | John J. Allen, Jr. (incumbent) | 120,666 | 84.3 | |
Progressive | John Allen Johnson | 22,408 | 15.7 | |
Total votes | 142,074 | 100.0 | ||
Turnout | {{{votes}}} | |||
Republican hold | ||||
Party | Candidate | Votes | % | |
---|---|---|---|---|
Republican | John J. Allen, Jr. (incumbent) | 64,083 | 53 | |
Democratic | Stanley K. Crook | 56,807 | 47 | |
Total votes | 120,890 | 100 | ||
Turnout | {{{votes}}} | |||
Republican hold | ||||
Party | Candidate | Votes | % | |
---|---|---|---|---|
Republican | John J. Allen, Jr. (incumbent) | 75,932 | 52.8 | |
Democratic | Laurance L. Cross | 67,931 | 47.2 | |
Total votes | 143,863 | 100.0 | ||
Turnout | {{{votes}}} | |||
Republican hold | ||||
Party | Candidate | Votes | % | |||
---|---|---|---|---|---|---|
Democratic | Jeffery Cohelan | 65,699 | 50.9 | |||
Republican | John J. Allen, Jr. (incumbent) | 63,270 | 49.1 | |||
Total votes | 128,969 | 100.0 | ||||
Turnout | {{{votes}}} | |||||
Democratic gain from Republican | ||||||
Party | Candidate | Votes | % | |
---|---|---|---|---|
Democratic | Jeffery Cohelan (incumbent) | 79,776 | 57.1 | |
Republican | Lewis F. Sherman | 60,065 | 42.9 | |
Total votes | 139,841 | 100.0 | ||
Turnout | {{{votes}}} | |||
Democratic hold | ||||
Party | Candidate | Votes | % | |
---|---|---|---|---|
Democratic | Jeffery Cohelan (incumbent) | 86,215 | 64.5 | |
Republican | Leonard L. Cantando | 47,409 | 35.5 | |
Total votes | 133,624 | 100.0 | ||
Turnout | {{{votes}}} | |||
Democratic hold | ||||
Party | Candidate | Votes | % | |
---|---|---|---|---|
Democratic | Jeffery Cohelan (incumbent) | 100,901 | 66.1 | |
Republican | Lawrence E. McNutt | 51,675 | 33.9 | |
Total votes | 192,576 | 100.0 | ||
Turnout | {{{votes}}} | |||
Democratic hold | ||||
Party | Candidate | Votes | % | |
---|---|---|---|---|
Democratic | Jeffery Cohelan (incumbent) | 84,644 | 64.4 | |
Republican | Malcolm M. Champlin | 46,763 | 35.6 | |
Total votes | 131,407 | 100.0 | ||
Turnout | {{{votes}}} | |||
Democratic hold | ||||
Party | Candidate | Votes | % | |
---|---|---|---|---|
Democratic | Jeffery Cohelan (incumbent) | 102,108 | 62.9 | |
Republican | Barney E. Hilburn | 48,133 | 29.6 | |
Peace and Freedom | Huey P. Newton | 12,164 | 7.5 | |
Total votes | 162,405 | 100.0 | ||
Turnout | {{{votes}}} | |||
Democratic hold | ||||
Party | Candidate | Votes | % | |
---|---|---|---|---|
Democratic | Ron Dellums | 89,784 | 57.3 | |
Republican | John E. Healy | 64,691 | 41.3 | |
Peace and Freedom | Sarah Scahill | 2,156 | 1.4 | |
Total votes | 156,631 | 100 | ||
Turnout | {{{votes}}} | |||
Democratic hold | ||||
Party | Candidate | Votes | % | |
---|---|---|---|---|
Democratic | Ron Dellums (incumbent) | 126,351 | 60 | |
Republican | Peter Hannaford | 85,851 | 38 | |
American Independent | Frank V. Cortese | 13,430 | 2 | |
Total votes | 225,632 | 100 | ||
Turnout | {{{votes}}} | |||
Democratic hold | ||||
Party | Candidate | Votes | % | |
---|---|---|---|---|
Democratic | George Miller | 82,765 | 55.6 | |
Republican | Gary Fernandez | 66,115 | 44.4 | |
Total votes | 148,880 | 100.0 | ||
Turnout | {{{votes}}} | |||
Democratic hold | ||||
Party | Candidate | Votes | % | |
---|---|---|---|---|
Democratic | George Miller (incumbent) | 147,064 | 74.7 | |
Republican | Robert L. Vickers | 45,863 | 23.3 | |
American Independent | Melvin E. Stanley | 3,889 | 2.0 | |
Total votes | 196,816 | 100.0 | ||
Turnout | {{{votes}}} | |||
Democratic hold | ||||
Party | Candidate | Votes | % | |
---|---|---|---|---|
Democratic | George Miller (incumbent) | 109,676 | 63.4 | |
Republican | Paula Gordon | 58,332 | 33.7 | |
American Independent | Melvin E. Stanley | 4,857 | 2.8 | |
Total votes | 172,865 | 100.0 | ||
Turnout | {{{votes}}} | |||
Democratic hold | ||||
Party | Candidate | Votes | % | |
---|---|---|---|---|
Democratic | George Miller (incumbent) | 142,044 | 63.3 | |
Republican | Giles St. Clair | 70,479 | 31.4 | |
Libertarian | Steve Snow | 6,923 | 3.1 | |
American Independent | Thomas J. Thompson | 5,023 | 2.2 | |
Total votes | 224,469 | 100.0 | ||
Turnout | {{{votes}}} | |||
Democratic hold | ||||
Party | Candidate | Votes | % | |
---|---|---|---|---|
Democratic | George Miller (incumbent) | 126,952 | 67.2 | |
Republican | Paul E. Vallely | 56,960 | 30.2 | |
Libertarian | Richard Newell | 2,752 | 1.5 | |
American Independent | Terry L. Wells | 2,205 | 1.2 | |
Total votes | 188,869 | 100.0 | ||
Turnout | {{{votes}}} | |||
Democratic hold | ||||
Party | Candidate | Votes | % | |
---|---|---|---|---|
Democratic | George Miller (incumbent) | 158,306 | 66.7 | |
Republican | Rosemary Thakar | 78,985 | 33.3 | |
Total votes | 237,291 | 100.0 | ||
Turnout | {{{votes}}} | |||
Democratic hold | ||||
Party | Candidate | Votes | % | |
---|---|---|---|---|
Democratic | George Miller (incumbent) | 124,174 | 66.6 | |
Republican | Rosemary Thakar | 62,379 | 33.4 | |
Total votes | 186,553 | 100.0 | ||
Turnout | {{{votes}}} | |||
Democratic hold | ||||
Party | Candidate | Votes | % | |
---|---|---|---|---|
Democratic | George Miller (incumbent) | 170,006 | 68.4 | |
Republican | Jean Last | 78,478 | 31.6 | |
Total votes | 248,484 | 100.0 | ||
Turnout | {{{votes}}} | |||
Democratic hold | ||||
Party | Candidate | Votes | % | |
---|---|---|---|---|
Democratic | George Miller (incumbent) | 121,080 | 60.5 | |
Republican | Roger A. Payton | 79,031 | 39.5 | |
Total votes | 200,111 | 100.0 | ||
Turnout | {{{votes}}} | |||
Democratic hold | ||||
Party | Candidate | Votes | % | |
---|---|---|---|---|
Democratic | George Miller (incumbent) | 153,320 | 70.3 | |
Republican | Dave Scholl | 54,822 | 25.2 | |
Peace and Freedom | David L. Franklin | 9,840 | 4.5 | |
Total votes | 217,982 | 100.0 | ||
Turnout | {{{votes}}} | |||
Democratic hold | ||||
Party | Candidate | Votes | % | |
---|---|---|---|---|
Democratic | George Miller (incumbent) | 116,015 | 69.69 | |
Republican | Charles V. Hughes | 45,698 | 27.43 | |
Peace and Freedom | William A. "Bill" Callison | 4,798 | 2.88 | |
Total votes | 166,601 | 100.0 | ||
Turnout | {{{votes}}} | |||
Democratic hold | ||||
Party | Candidate | Votes | % | |
---|---|---|---|---|
Democratic | George Miller (incumbent) | 137,089 | 71.9 | |
Republican | Norman Reece | 42,542 | 22.3 | |
Reform | William Thompson | 6,866 | 3.5 | |
Natural Law | Bruce Kendall | 4,420 | 2.3 | |
Total votes | 190,917 | 100.0 | ||
Turnout | {{{votes}}} | |||
Democratic hold | ||||
Party | Candidate | Votes | % | |
---|---|---|---|---|
Democratic | George Miller (incumbent) | 125,842 | 76.67 | |
Republican | Norman H. Reece | 38,290 | 23.33 | |
Total votes | 164,132 | 100.0 | ||
Turnout | {{{votes}}} | |||
Democratic hold | ||||
Party | Candidate | Votes | % | |
---|---|---|---|---|
Democratic | George Miller (incumbent) | 159,692 | 76.5 | |
Republican | Christopher A. Hoffman | 44,154 | 21.2 | |
Natural Law | Martin Sproul | 4,943 | 2.3 | |
Total votes | 208,789 | 100.0 | ||
Turnout | {{{votes}}} | |||
Democratic hold | ||||
Party | Candidate | Votes | % | |
---|---|---|---|---|
Democratic | George Miller (incumbent) | 97,849 | 70.8 | |
Republican | Charles R. Hargrave | 36,584 | 26.4 | |
Libertarian | Scott A. Wilson | 3,943 | 2.8 | |
Total votes | 138,376 | 100.0 | ||
Turnout | {{{votes}}} | |||
Democratic hold | ||||
Party | Candidate | Votes | % | |
---|---|---|---|---|
Democratic | George Miller (incumbent) | 166,831 | 76.1 | |
Republican | Charles Hargrave | 52,446 | 23.9 | |
Total votes | 219,277 | 100.0 | ||
Turnout | {{{votes}}} | |||
Democratic hold | ||||
Party | Candidate | Votes | % | |
---|---|---|---|---|
Democratic | George Miller (incumbent) | 118,000 | 84.0 | |
Libertarian | Camden McConnell | 22,486 | 16.0 | |
Total votes | 140,486 | 100.0 | ||
Turnout | {{{votes}}} | |||
Democratic hold | ||||
Party | Candidate | Votes | % | |
---|---|---|---|---|
Democratic | George Miller (incumbent) | 170,962 | 72.82 | |
Republican | Roger Allen Petersen | 51,166 | 21.79 | |
Peace and Freedom | Bill Callison | 6,695 | 2.85 | |
Libertarian | Camden McConnell | 5,950 | 2.53 | |
Total votes | 234,773 | 100.0 | ||
Turnout | {{{votes}}} | |||
Democratic hold | ||||
Party | Candidate | Votes | % | |
---|---|---|---|---|
Democratic | George Miller (incumbent) | 122,435 | 68% | |
Republican | Rick Tubbs | 56,764 | 32% | |
Total votes | 179,199 | 100% | ||
Turnout | {{{votes}}} | |||
Democratic hold | ||||
Party | Candidate | Votes | % | |||
---|---|---|---|---|---|---|
Democratic | Ami Bera | 141,241 | 51.7% | |||
Republican | Dan Lungren (Incumbent) | 132,050 | 48.3% | |||
Total votes | 273,291 | 100.0% | ||||
Democratic gain from Republican |
Party | Candidate | Votes | % | |
---|---|---|---|---|
Democratic | Ami Bera (Incumbent) | 92,521 | 50.4% | |
Republican | Doug Ose | 91,066 | 49.6% | |
Total votes | 183,587 | 100.0% | ||
Democratic hold |
Party | Candidate | Votes | % | |
---|---|---|---|---|
Democratic | Ami Bera (Incumbent) | 152,133 | 51.2% | |
Republican | Scott Jones | 145,168 | 48.8% | |
Total votes | 297,301 | 100.0% | ||
Democratic hold |
Party | Candidate | Votes | % | |
---|---|---|---|---|
Democratic | Ami Bera (incumbent) | 155,016 | 55% | |
Republican | Andrew Grant | 126,601 | 45% | |
Total votes | 281,617 | 100% | ||
Democratic hold | ||||
Party | Candidate | Votes | % | |
---|---|---|---|---|
Democratic | Ami Bera (incumbent) | 217,416 | 56.6 | |
Republican | Buzz Patterson | 166,549 | 43.4 | |
Total votes | 383,965 | 100.0 | ||
Democratic hold | ||||
Party | Candidate | Votes | % | |
---|---|---|---|---|
Democratic | Doris Matsui (incumbent) | 150,618 | 68.3 | |
Republican | Max Semenenko | 70,033 | 31.7 | |
Total votes | 220,651 | 100.0 | ||
Democratic hold | ||||
Villa Park is a city in northern Orange County, California, United States. It was founded in 1962. At the 2010 census, the city had a population of 5,812, making it the smallest city in Orange County.
Canyon Lake is a city and gated community in Riverside County, California, United States, located on Canyon Lake reservoir. Canyon Lake began as a master-planned community developed by the Corona Land Company in 1968. The City of Canyon Lake was incorporated on December 1, 1990. Railroad Canyon Dam was built in 1927, and impounds the San Jacinto River to fill the reservoir, which covers 383 acres (1.55 km2) and has 14.9 miles (24.0 km) of shoreline.
Doris Okada Matsui is an American politician, who has served as a member of the United States House of Representatives from California's 7th congressional district since 2005. The district, numbered as the 5th from 2005 to 2013 and the 6th from 2013 to 2023, is based in Sacramento.
California's 9th congressional district is a congressional district in the U.S. state of California. Josh Harder, a Democrat, has represented the district since January 2023.
California's 10th congressional district is a congressional district in the U.S. state of California. Currently, the 10th district encompasses parts of the eastern San Francisco Bay Area. It is currently represented by Democrat Mark DeSaulnier.
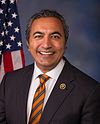
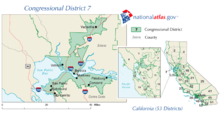
California's 6th congressional district is a congressional district in the U.S. state of California. It is represented by Democrat Ami Bera.
California's 18th congressional district is a congressional district located in the U.S. state of California. The district is currently represented by Democrat Zoe Lofgren. Since the 2022 election, the district is landlocked and includes all of San Benito County and parts of Santa Clara and Monterey counties, including Salinas, Hollister, Watsonville, Gilroy, Soledad, and downtown and eastern San Jose.
California's 5th congressional district is a U.S. congressional district in California.
California's 8th congressional district is a congressional district in the U.S. state of California. As of 2023, Democrat John Garamendi represents the district. Currently, the 8th district includes parts of the Bay Area counties of Contra Costa County and Solano County, including the cities of Vallejo, Fairfield, Richmond and parts of Martinez.
California's 4th congressional district is a U.S. congressional district in California. The district is located in the northwestern part of the state, and includes all of Lake County and Napa County, most of Yolo County, and parts of Solano County and Sonoma County. Major cities in the district include Davis, Woodland, Napa, Vacaville, and most of Santa Rosa. The new 4th district is solidly Democratic, and is represented by Mike Thompson.
California's 2nd congressional district is a U.S. congressional district in California. Jared Huffman, a Democrat, has represented the district since January 2013. Currently, it encompasses the North Coast region and adjacent areas of the state. It stretches from the Golden Gate Bridge to the Oregon border, and includes all of the portions of Highway 101 within California that are north of San Francisco, excepting a stretch in Sonoma County. The district consists of Marin, Mendocino, Humboldt, Del Norte, and Trinity Counties, plus portions of Sonoma County. Cities in the district include San Rafael, Petaluma, Novato, Windsor, Healdsburg, Ukiah, Fort Bragg, Fortuna, Eureka, Arcata, McKinleyville, Crescent City, and northwestern Santa Rosa.
California's 3rd congressional district is a U.S. congressional district in California. It includes the northern Sierra Nevada and northeastern suburbs of Sacramento, stretching south to Death Valley. It encompasses Alpine, Inyo, Mono, Nevada, Placer, Plumas, and Sierra counties, as well as parts of El Dorado, Sacramento, and Yuba counties. It includes the Sacramento suburbs of Roseville, Folsom, Orangevale, Rocklin, and Lincoln, and the mountain towns of Quincy, South Lake Tahoe, Truckee, Mammoth Lakes, and Bishop. The district is represented by Republican Kevin Kiley.
California's 13th congressional district is a congressional district in the U.S. state of California. John Duarte, a Republican, has represented this district since January 2023.
California's 14th congressional district is a congressional district in the U.S. state of California. Eric Swalwell, a Democrat, has represented the district since January 2023.
California's 16th congressional district is a congressional district in the U.S. state of California. It includes portions of Santa Clara and San Mateo counties, extending from the southwestern San Francisco Bay Area through the Santa Cruz Mountains to the Pacific coast. The district is currently represented by Democrat Anna Eshoo.
California's 17th congressional district is a congressional district in the U.S. state of California that is currently represented by Ro Khanna. It is located in the South Bay and East Bay regions of the San Francisco Bay Area.
California's 19th congressional district is a congressional district in the U.S. state of California, currently represented by Democrat Jimmy Panetta.
California's 24th congressional district is a congressional district in the U.S. state of California. The district is currently represented by Salud Carbajal. It contains all of Santa Barbara County, most of San Luis Obispo County, and part of Ventura County. Cities in the district include Santa Barbara, Ventura, San Luis Obispo, Santa Maria, and Ojai.
California's 39th congressional district is a congressional district in the U.S. state of California. The district includes parts of Riverside County, including Jurupa Valley, Riverside, Moreno Valley, and Perris. The district has been represented by Democrat Mark Takano ever since he was redistricted from the 41st congressional district in 2022.
Julia Andrews Brownley is an American businesswoman and politician who has been the United States representative for California's 26th congressional district since 2013. A Democrat, she served in the California State Assembly from 2006 to 2012. Before her political career, she worked in marketing and sales.