fuels, machinery and transport equipment, construction materials, grain, fertilizers, electricity, mineral products, chemical products, plastic materials and products[3]
Historical GDP per capita development of El Salvador, Guatemala and Honduras
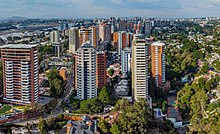
The economy of Guatemala is a considered a developing economy, highly dependent on agriculture, particularly on traditional crops such as coffee, sugar, and bananas.[15]Guatemala's GDP per capita is roughly one-third of Brazil's.[16] The Guatemalan economy is the largest in Central America. It grew 3.3 percent on average from 2015 to 2018.[17] However, Guatemala remains one of the poorest countries in Latin America and the Caribbean, having highly unequal incomes and chronically malnourished children. The country is beset by political insecurity, and lacks skilled workers and infrastructure. It depends on remittances for nearly one-tenth of the GDP.[18]
The 1996 peace accords ended the 36-years-long Guatemalan Civil War, and removed a major obstacle to foreign investment. Since then Guatemala has pursued important reforms and macroeconomic stabilization.[19] On 1 July 2006, the Central American Free Trade Agreement (CAFTA) entered into force between the United States and Guatemala. It has since spurred increased investment in the export sector.[20] The distribution of income remains highly unequal, with 12% of the population living below the international poverty line.[21] Guatemala's large expatriate community in the United States, has made it the top remittance recipient in Central America. These inflows are a primary source of foreign income, equivalent to nearly two-thirds of exports.
Guatemala's gross domestic product for 1990 was estimated at $19.1 billion, with real growth slowing to approximately 3.3%. Ten years later, in 2000, it rose from 1 to 4% and by 2010 it had fallen back to 3%, according to the World Bank. The final peace accord in December 1996 left Guatemala well-positioned for rapid economic growth.[22][citation needed]
Guatemala's economy is dominated by the private sector, which generates about 85% of GDP.[citation needed] Most of its manufacturing is light assembly and food processing, geared to the domestic, U.S., and Central American markets. In 1990 the labor force participation rate for women was 42%, later increasing by 1% in 2000 to 43% and 51% in 2010. For men, the labor force participation rate in 1990 was about 89%, decreased to 88% in 2000, and increased up to 90% in 2010 (World Bank). Self-employment for men is about 50%, while the rate for women is about 32% (Pagàn 1).
Over the past several years, tourism and exports of textiles, apparel, and nontraditional agricultural products such as winter vegetables, fruit, and cut flowers have boomed, while more traditional exports such as sugar, bananas, and coffee continue to represent a large share of the export market.[citation needed]Over the past twenty years the percentage of exports of goods and services has fluctuated. In 1990 it was 21% and in 2000, 20%. It increased again in 2010 to 26%. On the other hand, its level of imports of goods and services has continually increased. In 1990 its imports of goods and services was about 25%. In 2000 it increased by 4% up to 29%, and in 2010 it increased up to 36%. Migration is another important avenue in Guatemala. According to Cecilia Menjivar, remittances are "central to the economy." In 2004 remittances to Guatemala from men's migration to the U.S. accounted for approximately 97% (Menjivar 2).
The United States is the country's largest trading partner, providing 36% of Guatemala's imports and receiving 40% of its exports.[23] The government sector is small and shrinking, with its business activities limited to public utilities—some of which have been privatized—ports and airports and several development-oriented financial institutions. Guatemala was certified to receive export trade benefits under the United States' Caribbean Basin Trade and Partnership Act (CBTPA) in October 2000, and enjoys access to U.S. Generalized System of Preferences (GSP) benefits. Due to concerns over serious worker rights protection issues, however, Guatemala's benefits under both the CBTPA and GSP are currently under review.[citation needed]
The country is predominantly poor, with 49 percent of the population living in rural areas. Guatemala is characterized by a markedly unequal distribution of wealth, assets, and opportunities: between 2000 and 2014, rural poverty increased from 74.5 to 76.1 percent, while extreme rural poverty increased from 23.8 to 35.3 percent. Young people and indigenous communities are the most vulnerable. Among indigenous people, who comprise almost 40 percent of the total population, the poverty rate is approximately 80 percent.[24]
The Inequality-adjusted HDI (IHDI) index for Guatemala is 0.481 (Data from 2019), below the average for Latin America (0.596) and distant from the countries with very high human development (0.800).[25]
Economic development and poverty in Guatemala
From 1990 until 2018, Guatemala was growing with an annual GDP growth oscillating around 3.5%.[26]
Manufacturing (20%), commerce (18%), private services (14%), and agriculture (12%) are the biggest estimated economic sectors in Guatemala. The country's economic structure shows a declining trend in the agricultural sector.[27]
Guatemala is the third biggest country in Central America. It has one of the highest disparities between rich and poor as well as one of the highest poverty levels worldwide, with 54% of the population living below the poverty line in 2006 and 54% in 2011.[28] According to the United Nations Development Programme (UNDP), the Multidimensional Poverty Index (MPI), which looks at multiple deprivations in the same household in regard to education, health and standard of living, found that in 2011, 25.9% of the population experienced multiple deprivations and another 9.8% were vulnerable to such deprivations.[29] A human development report also states that the average percentage of multidimensional poverty in 2011 was 49.1%.[30]
Poor women and unpaid work
In Guatemala in 2010, 31% of the female population was illiterate.[31] In rural Guatemala, 70.5% are poor; women are more likely to be poor in the more rural areas.[32] Gammage argues that women in poor households engage more in domestic tasks and undertake more household maintenance, social reproduction and care work than men.[33] Similarly, Benería states that the women perform tough work but do not get paid and argues that there is an opportunity cost related, since the women could be paid for other work instead.[34] Unpaid household work is associated with the number of people in the household, the location, and the availability of paid employment.[32] This means that women in rural Guatemala are greater victims of poverty than urban women, and most poverty is found in the rural parts of Guatemala, so Gammage found that many rural women perform unpaid work.[33]
Educated women and the labor force
The labor force participation rate for women in Guatemala was at 41% in 2018.[35] Women have a small pay disadvantage, earning 97% of male wages in most occupations.[31]Gender inequality declines if women have a second and/or third educational degree, and they are treated more equally with their male counterparts. As in many countries, both men and women earn the most if they have a university degree.[31] The percent of women with a steady income increases for women who have completed the secondary level of schooling, but decreases again after university.[34] This means that women earn about the same as men if they both have a secondary education, but after university, men earn more. The situation changes on the professional level, where women earn more than men.[31] Men work more hours in all professions, except in the household, because many women have part-time jobs.[31]
Child labor
Children in Guatemala are engaged in child labor, primarily in agriculture, according to the U.S. Department of Labor. In fact, 13.4% of children aged 7 to 14 work; 68% of them are in the agricultural sector, 13% in the industrial sector, and 18% in the services sector.[36] The 2013 DOL report stated that "Guatemala [...] lacks Government programs targeting sectors in which children are known to engage in exploitative labor, such as domestic service, mining, quarrying, and construction." In December 2014, the Department's List of Goods Produced by Child Labor or Forced Labor included mostly agricultural goods produced in such working conditions, namely broccoli, coffee, corn and sugarcane. Guatemala's firework and gravel production also resorted to child labor according to the report.
Maquilas
Among the most important factors in Guatemala's economy are the significant number of Korean-owned maquila factories in the highlands of Guatemala. Korean entrepreneurs have adopted a buyer-driven commodity chain process that depends on the existence of a large labor force, low capital investment and low skills. Korea presents itself to Guatemalan industry and to Guatemalan workers by means of subcontractors responsible for delivering finished orders to multiple buyers, mostly located in the United States. Buyers include Macy's and JCPenney and brands such as Liz Claiborne, OshKosh and Tracy Evans.
The first industries began in 1980s. At first, workers were very interested in the new jobs in the factories, because they offered the opportunity to transition to what was seen as a new and modern world, away from agricultural work. However, in the factories, workers' backs hurt, because they sat for many hours on backless benches in front of sewing machines. Workers would usually enter the plant at 7:00a.m. and take a 1-hour break for lunch at noon. They were expected to work until 7:00 or 8:00pm. About 70% of the workers in macula factories were female. Years later, there was a huge turnover. Workers started to leave the maquila factories for reasons including stress, bad treatment, poor payment, etc.[37]
The legal framework as of 2024 is the Law for the Promotion and Development of Export Activities and Maquilas aimed mainly at the apparel and textile sector and at services exporters such as call centers and business processes outsourcing (BPO) companies. The government grants investors in these two sectors a 10-year income tax exemption. Additionally there is an exemption from duties and value-added taxes (VAT) on imported machinery and equipment and a one-year suspension of the same duties and taxes on imports of production inputs, samples, and packing material.[38]
Simplifying the tax structure, enhancing tax compliance, and broadening the tax base.
Improving the investment climate through procedural and regulatory simplification and adopting a goal of concluding treaties to protect investment and intellectual property rights.
Import tariffs have been lowered in conjunction with Guatemala's Central American neighbors so that most fall between 0% and 15%, with further reductions planned. Responding to Guatemala's changed political and economic policy environment, the international community has mobilized substantial resources to support the country's economic and social development objectives. The United States, along with other donor countries—especially France, Italy, Spain, Germany, Japan, and the international financial institutions—have increased development project financing. Donors' response to the need for international financial support funds for implementation of the Peace Accords is, however, contingent upon Guatemalan government reforms and counterpart financing.
Problems hindering economic growth include high crime rates, illiteracy and low levels of education, and an inadequate and underdeveloped capital market. They also include lack of infrastructure, particularly in the transportation, telecommunications, and electricity sectors, although the state telephone company and electricity distribution were privatized in 1998. The distribution of income and wealth remains highly skewed. The wealthiest 10% of the population receives almost one-half of all income, and the top 20% receives two-thirds of all income. Approximately 29% of the population lives in poverty, and 6% of that number live in extreme poverty. Guatemala's social indicators, such as infant mortality and illiteracy, are successively improving, but remain in low growth and are still among the worst in the hemisphere.[39] In 2000 the percentage of girls completing primary school was approximately 52%. That percentage rose in 2010 to about 81%. The completion rate in primary school for boys in 2000 was 63% and rose to 87% in 2010.
The electricity sector is being privatized, resulting in very high prices. In rural areas, although electricity consumption per household is very low, the ratings can represent more than 20% of farmers' salaries according to the Comité de développement paysan (Codeca). Since privatization, the price per kilowatthour has risen to the point of becoming one of the most expensive in Latin America. To protest against this situation and demand the renationalization of electrical services, Codeca members organized demonstrations and exposed themselves to repression. Between 2012 and 2014, 97 people were imprisoned, 220 wounded and 17 killed.
2009 food crisis
In September 2009, Guatemalan President Álvaro Colom declared that lack of food and proper nutrition were a national emergency. Colom stated that the situation is the combined result of a severe drought and global warming, which have reduced the domestic food supply, and the global financial crisis, which reduced Guatemala's ability to import food. Colom said the government would immediately seek assistance from the international community for emergency food supplies.[41]
A number of international organizations expressed concern about Guatemala's current economic status in 2009. The United NationsWorld Food Programme (WFP) and the World Bank reported the following:
Guatemala has the fourth highest rate of chronic malnutrition in the world and the highest in the western hemisphere.
Approximately 75% of Guatemalans live below the poverty level, which is defined as an income that is not sufficient to purchase a basic basket of goods and basic services.
Approximately 58% of the population have incomes below the extreme poverty line, which is defined as the amount needed to purchase a basic basket of food.
Approximately 50% of Guatemalan children under the age of 5 now suffer from chronic under-nutrition.
In the nation's highlands, where many indigenous people live, 70% of children under age 5 are malnourished.[41]
Agriculture
Guatemala is the world leader in cardamom production and export. As of 2013, demand for biofuels has resulted in diversion of land from subsistence agriculture to sugar cane and African Palm plantations. Much of the land is owned by large landlords. Due to legal requirements for production of biofuels in the United States the price of maize, a Guatemalan staple, has risen sharply.[42] Agriculture accounts for 60% of Guatemalan exports and employs more than 50% of the labor force.[43]
In 2018, Guatemala produced 35.5 million tons of sugarcane (it's one of the 10 largest producers in the world) and 4 million tons of banana (it's one of the 15 largest world producers). In addition, in the same year it produced 2.3 million tons of palm oil, 245 thousand tons of coffee, 1.9 million tons of maize, 623 thousand tons of melon, 312 thousand tons of pineapple, 564 thousand tons of potato, 349 thousand tons of rubber, 331 thousand tons of tomato, 253 thousand tons of beans, 124 thousand tons of avocado, 124 thousand tons of lemon, 177 thousand tons of orange, 120 thousand tons of cauliflower and broccoli, 93 thousand tons of papaya, 107 thousand tons of watermelon, 98 thousand tons of carrot, 75 thousand tons of cabbage, 84 thousand tons of lettuce and chicory, 38 thousand tons of cardamom in addition to smaller productions of other agricultural products.[44]
Scale
The agricultural sector of Guatemala's economy consists of two types of producers: numerous small-scale peasant-owned farms in the highlands, and fewer medium- to large-scale operations in the more fertile lowlands.[45] The smaller farms produce staples for Guatemalan consumption, such as beans and maize, as well as fruits and vegetables for export. Larger farms produce export and plantation products like bananas, sugar cane, coffee, and rubber and palm oil.[45][46] While 88% of agricultural land in Guatemala is in large-scale farms, 92% of all farms in Guatemala are small. Large farms produce 1/3 more per hectare than small farms, but employ fewer people overall.[45]
Non-traditional agricultural exports
The shift to the production of non-traditional agricultural exports (NTAE) is a strategy used by developing countries like Guatemala to grow the agricultural sector and decreasing inequality by including the rural poor in the benefits of globalization.[47] The most important NTAE crops in Guatemala include
fruit like mangos, melons, and berries
vegetables like cauliflower, cabbage, broccoli, and snow peas
organic crops such as coffee.[48] The value of non-traditional agricultural export crops has increased from $146 million US in 1992 to $262 million in 2001.[49] IN 1998, NTAE accounted for 8.7 percent of the total exports.[48] NTAE production largely comes from small-scale farmers. While the farmers who are involved in this market are not failing, this market limits their capital accumulation to slow growth, and therefore they are not able to profit highly off of this market.[50]
Gender
The agricultural sector of Guatemala is differentiated by gender, and this differential can be seen in several different areas within the sector. More men than women inherit or buy land individually, although many houses choose to rent land instead of buying it.[51] Additionally, there is a gender gap in the division of agricultural labor. Traditionally, men dominated subsistence production and agricultural production for domestic markets, while women had roles in small animal production, craft production, and the selling of products in regional rather than national markets.[51] With the shift toward NTAE, there has also been an increase in field labor for women.[51] Additionally, women have been included in land-use decision processes in NTAE production. Sarah Hamilton, Linda Asturias de Barrios, and Brenda Tevalán have stated that despite a traditional patriarchal structure in Guatemala, NTAE production is associated with increased independence and equality between men and women.[51]
Macroeconomic development
Guatemala became more economically developed and stable from 1990 to 2011. The annual GDP growth rate for Guatemala in 2000 was 3.6%, but just 0.9% in 2009, increasing slightly in 2010 to 2.0%[29][52] The poverty rate in Guatemala in 2006 was 54.8%, and the extreme poverty rate was 26.1%. Latin America as a whole had a poverty rate of 33% and an extreme poverty rate of 12.9% in 2009.[53] The data indicate that Guatemala is behind other Latin American countries, in terms of lowering poverty rates, but there has been an increase in economic activity in terms of GDP and development. Guatemala's HDI increased from 0.462 in 1990, to 0.525 in 2000, to 0.550 in 2005, and 0.574 in 2011.3 Guatemala ranked 131st in HDI in 2011.[29] Other important human development statistics such as the total fertility rate in Guatemala decreased from 4.8 births per woman in 2000 to 4.2 births per woman in 2006.[52] During the same period, life expectancy increased from 67.9 years in 2000, to 69.9 years in 2006.[52]
The following table shows the main economic indicators in 1980–2021 (with IMF staff estimates in 2022–2027).[54] Inflation below 5% is in green. The annual unemployment rate is extracted from the World Bank, although the International Monetary Fund find them unreliable.[55]
Year
GDP
(in Bil. US$PPP)
GDP per capita
(in US$ PPP)
GDP
(in Bil. US$nominal)
GDP per capita
(in US$ nominal)
GDP growth
(real)
Inflation rate
(in Percent)
Unemployment
(in Percent)
Government debt
(in% of GDP)
1980
19.2
2,660.2
7.7
1,070.3
3.7%
10.7%
n/a
n/a
1981
21.1
2,857.9
8.4
1,140.2
0.6%
11.4%
n/a
n/a
1982
21.6
2,854.5
8.5
1,126.2
-3.5%
4.9%
n/a
n/a
1983
21.9
2,819.3
8.9
1,140.0
-2.5%
6.7%
n/a
n/a
1984
22.8
2,862.6
9.3
1,163.1
0.5%
3.2%
n/a
n/a
1985
23.4
2,861.9
11.0
1,338.7
-0.6%
19.2%
n/a
n/a
1986
23.9
2,849.4
5.9
705.8
0.1%
32.8%
n/a
n/a
1987
25.4
2,949.2
6.9
797.0
3.6%
10.8%
n/a
n/a
1988
27.3
3,093.7
7.4
841.8
3.9%
10.3%
n/a
n/a
1989
29.5
3,260.3
8.6
946.8
3.9%
13.0%
n/a
n/a
1990
31.5
3,403.7
7.5
808.9
3.1%
38.0%
n/a
n/a
1991
33.6
3,540.5
9.2
966.0
3.0%
35.1%
2.6%
n/a
1992
35.9
3,699.9
10.2
1,045.4
4.6%
10.2%
2.6%
n/a
1993
38.0
3,825.6
11.0
1,110.0
3.4%
13.4%
2.6%
n/a
1994
40.2
3,951.2
12.5
1,229.0
3.5%
12.5%
2.6%
n/a
1995
42.8
4,116.0
14.0
1,348.9
4.4%
8.4%
2.6%
n/a
1996
44.8
4,212.4
15.0
1,408.2
2.8%
11.1%
2.7%
n/a
1997
47.5
4,362.0
17.0
1,559.6
4.1%
9.2%
2.7%
n/a
1998
50.2
4,512.1
18.4
1,656.4
4.6%
6.6%
2.7%
n/a
1999
52.8
4,639.2
17.4
1,527.2
3.7%
5.2%
2.7%
n/a
2000
55.4
4,752.9
18.1
1,555.6
2.5%
6.0%
2.7%
18.0%
2001
58.0
4,862.2
19.7
1,655.0
2.4%
7.3%
2.8%
19.1%
2002
61.4
5,027.9
21.9
1,795.8
4.2%
8.1%
2.8%
17.4%
2003
64.2
5,138.5
23.1
1,847.3
2.6%
5.6%
2.8%
19.8%
2004
67.9
5,307.3
25.0
1,951.8
3.0%
7.6%
3.0%
20.6%
2005
72.2
5,512.6
28.2
2,151.7
3.1%
9.1%
3.1%
20.0%
2006
78.6
5,864.7
31.3
2,337.0
5.6%
6.6%
3.1%
20.9%
2007
85.6
6,246.2
35.0
2,556.8
6.0%
6.8%
3.1%
20.8%
2008
90.4
6,454.9
40.2
2,873.1
3.7%
11.4%
3.3%
19.6%
2009
91.6
6,395.8
38.0
2,654.1
0.6%
1.9%
3.5%
22.8%
2010
95.3
6,511.4
41.5
2,836.1
2.8%
3.9%
3.5%
24.0%
2011
101.6
6,794.3
47.4
3,172.1
4.4%
6.2%
3.1%
23.8%
2012
107.2
7,017.7
49.9
3,267.8
3.1%
3.8%
2.8%
24.6%
2013
112.0
7,183.1
53.0
3,397.6
3.5%
4.3%
3.0%
25.0%
2014
118.8
7,457.9
57.8
3,632.1
4.4%
3.4%
2.7%
24.7%
2015
127.6
7,849.1
62.2
3,825.9
4.1%
2.4%
2.5%
24.8%
2016
130.1
7,847.2
66.0
3,982.0
2.7%
4.4%
2.6%
25.0%
2017
133.9
7,912.5
71.6
4,233.0
3.1%
4.4%
2.5%
25.1%
2018
141.8
8,210.5
73.3
4,247.5
3.4%
3.8%
2.3%
26.4%
2019
150.1
8,518.5
77.2
4,379.8
4.0%
3.7%
2.2%
26.4%
2020
149.2
8,300.2
77.6
4,318.6
-1.8%
3.2%
3.6%
31.5%
2021
167.8
9,148.9
86.0
4,687.8
8.0%
4.3%
3.6%
30.8%
2022
185.8
9,931.4
91.3
4,879.9
3.4%
6.4%
n/a
30.1%
2023
198.6
10,402.8
95.6
5,006.7
3.2%
5.6%
n/a
30.0%
2024
210.6
10,809.0
102.9
5,280.9
3.8%
4.3%
n/a
29.7%
2025
222.3
11,183.1
110.2
5,545.5
3.6%
4.0%
n/a
29.6%
2026
234.6
11,564.2
117.9
5,815.0
3.5%
4.0%
n/a
29.4%
2027
247.5
11,957.2
126.1
6,094.9
3.5%
4.0%
n/a
29.3%
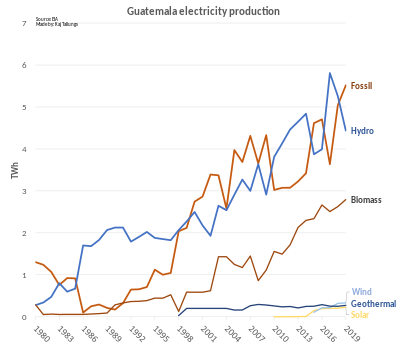
Electrical infrastructure in rural Guatemala
Guatemala electricity production by year
In Guatemala lack of access to electricity is concentrated in rural areas, although informal settlements around urban peripheries also tend to lack metered service.[56] Guatemala's post-civil war efforts to improve electrical access in the countryside have proceeded under the auspices of the Rural Electrification Plan (Spanish: PER), a public-private partnership between the government's Ministry of Education and Mines (Mineduc) and private power companies.[57] Over the period 2000 to 2011, the PER improved rates of electrical grid connectivity among non-indigenous (62 to 82 percent) and indigenous (48 to 70 percent) households in Guatemala.[57] Continuity of the electrical grid is robust, with both groups reporting only about one hour per day of unavailability.[57] Even when rural users are connected to the grid and pay subsidized rates, they often have difficulty affording electrical appliances, which translates into low power consumption (less than five percent of average US residential usage).[58] This low power usage by rural customers is often not profitable for power companies,[58] disincentivizing further expansion of the grid. As of 2014, one third of Guatemala's poorest rural residents still lacked electricity.[56] By contrast, only around 8% of high-income rural residents lacked service,[56] demonstrating that affordability plays a role in the accessibility of electrical grids.
In 2016, domestic hydroelectric power supplied the majority (about 34 percent) of Guatemala's electricity.[59] The planning process for constructing new hydropower dams was updated by the Guatemalan Congress in 1996 and 2007 (Decree 93–96, the "General Law of Electricity"),[60] giving project developers more power over the process, especially with regards to environmental impact assessments (EIA).[60] A study in Guatemala covering the period 2009 to 2014 found that private construction firms generally have little knowledge of the rights of rural indigenous peoples their projects may be affecting.[60] Firms typically hire consultants to perform EIAs and liaise with affected communities.[60] However, consultants are frequently disinterested in adequately informing rural communities of the potential impacts of proposed projects.[60] Instead, consultants frequently resort to bribery and manipulation to obtain consent to proceed with hydroelectric projects.[60] Interlocutors from within the government say that there is internal pressure to approve EIAs even if they are performed inadequately,[60] showing that visions of Guatemala's energy future may be overriding the interests of segments of its populace.
Tariffs applied by Guatemala as provided by ITC's Market Access Map, an online database of customs tariffs and market requirements.
Related Research Articles
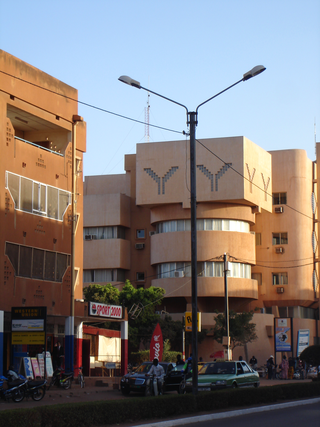
The economy of Burkina Faso is based primarily on subsistence farming and livestock raising. Burkina Faso has an average income purchasing-power-parity per capita of $1,900 and nominal per capita of $790 in 2014. More than 80% of the population relies on subsistence agriculture, with only a small fraction directly involved in industry and services. Highly variable rainfall, poor soils, lack of adequate communications and other infrastructure, a low literacy rate, and a stagnant economy are all longstanding problems of this landlocked country. The export economy also remained subject to fluctuations in world prices.
The economy of the Central African Republic is $2.321 billion by gross domestic product as of 2019, with an estimated annual per capita income of just $805 as measured by purchasing power parity in 2019.
The economy of the Democratic Republic of the Congo has declined drastically around the 1980s, despite being home to vast potential in natural resources and mineral wealth; their gross domestic product is $69.474 billion as of 2023.
The economy of the Dominican Republic is the seventh largest in Latin America, and is the largest in the Caribbean and Central American region. The Dominican Republic is an upper-middle income developing country with important sectors including mining, tourism, manufacturing, energy, real estate, infrastructure, telecommunications and agriculture. The Dominican Republic is on track to achieve its goal of becoming a high-income country by 2030, and is expected to grow 79% in this decade. The country is the site of the single largest gold mine in Latin America, the Pueblo Viejo mine.Although the service sector is currently the leading employer of Dominicans, agriculture remains an important sector in terms of the domestic market and is in second place in terms of export earnings. Tourism accounts for more than $7.4 billion in annual earnings in 2019. Free-trade zone earnings and tourism are the fastest-growing export sectors. A leading growth engine in the Free-trade zone sector is the production of medical equipment for export having a value-added per employee of $20,000 USD, total revenue of $1.5 billion USD, and a growth rate of 7.7% in 2019. The medical instrument export sector represents one of the highest-value added sectors of the country's economy, a true growth engine for the country's emerging market. Remittances are an important sector of the economy, contributing $8.2 billion in 2020. Most of these funds are used to cover household expenses, such as housing, food, clothing, health care and education. Secondarily, remittances have financed businesses and productive activities. Thirdly, this combined effect has induced investment by the private sector and helps fund the public sector through its value-added tax. The combined import market including the free-trade-zones amounts to a market of $20 billion a year in 2019. The combined export sector had revenues totaling $11 billion in 2019. The consumer market is equivalent to $61 billion in 2019. An important indicator is the average commercial loan interest rate, which directs short-term investment and stimulates long-term investment in the economy. It is currently 8.30%, as of June 2021.
The economy of Ecuador is the eighth largest in Latin America and the 69th largest in the world by total GDP. Ecuador's economy is based on the export of oil, bananas, shrimp, gold, other primary agricultural products and money transfers from Ecuadorian emigrants employed abroad. In 2017, remittances constituted 2.7% of Ecuador's GDP. The total trade amounted to 42% of the Ecuador's GDP in 2017.
The economy of Ethiopia is a mixed and transition economy with a large public sector. The government of Ethiopia is in the process of privatizing many of the state-owned businesses and moving toward a market economy. The banking, telecommunication and transportation sectors of the economy are dominated by government-owned companies.
The economy of Honduras is based mostly on agriculture, which accounts for 14% of its gross domestic product (GDP) in 2013. The country's leading export is coffee (US$340 million), which accounted for 22% of the total Honduran export revenues. Bananas, formerly the country's second-largest export until being virtually wiped out by 1998's Hurricane Mitch, recovered in 2000 to 57% of pre-Mitch levels. Cultivated shrimp is another important export sector. Since the late 1970s, towns in the north began industrial production through maquiladoras, especially in San Pedro Sula and Puerto Cortés.
The economy of Jamaica is heavily reliant on services, accounting for 71% of the country's GDP. Jamaica has natural resources and a climate conducive to agriculture and tourism. The discovery of bauxite in the 1940s and the subsequent establishment of the bauxite-alumina industry shifted Jamaica's economy from sugar, and bananas.
The economy of Kyrgyzstan is heavily dependent on the agricultural sector. Cotton, tobacco, wool, and meat are the main agricultural products, although only tobacco and cotton are exported in any quantity. According to Healy Consultants, Kyrgyzstan's economy relies heavily on the strength of industrial exports, with plentiful reserves of gold, mercury and uranium. The economy also relies heavily on remittances from foreign workers. Following independence, Kyrgyzstan was progressive in carrying out market reforms, such as an improved regulatory system and land reform. In 1998, Kyrgyzstan was the first Commonwealth of Independent States (CIS) country to be accepted into the World Trade Organization. Much of the government's stock in enterprises has been sold. Kyrgyzstan's economic performance has been hindered by widespread corruption, low foreign investment and general regional instability. Despite those issues, Kyrgyzstan is ranked 70th on the ease of doing business index.
The economy of Libya depends primarily on revenues from the petroleum sector, which represents over 95% of export earnings and 60% of GDP. These oil revenues and a small population have given Libya one of the highest nominal per capita GDP in Africa.
The economy of Mali is based to a large extent upon agriculture, with a mostly rural population engaged in subsistence agriculture.
The economy of Paraguay is a market economy that is highly dependent on agriculture products. In recent years, Paraguay's economy has grown as a result of increased agricultural exports, especially soybeans. Paraguay has the economic advantages of a young population and vast hydroelectric power. Its disadvantages include the few available mineral resources, and political instability. The government welcomes foreign investment.
The economy of Sudan is largely based on agriculture and oil exports, with additional revenue coming from mining and manufacturing. GDP growth registered more than 10% per year in 2006 and 2007. Sudan had $30.873 billion by gross domestic product as of 2019, and has been working with the International Monetary Fund (IMF) to implement macroeconomic reforms, including a managed float of the exchange rate. Sudan began exporting crude oil in the last quarter of 1999.
The economy of Tajikistan is dependent upon agriculture and services. Since independence, Tajikistan has gradually followed the path of transition economy, reforming its economic policies. With foreign revenue precariously dependent upon exports of cotton and aluminium, the economy is highly vulnerable to external shocks. Tajikistan's economy also incorporates a massive black market, primarily focused on the drug trade with Afghanistan. Heroin trafficking in Tajikistan is estimated to be equivalent to 30-50% of national GDP as of 2012.
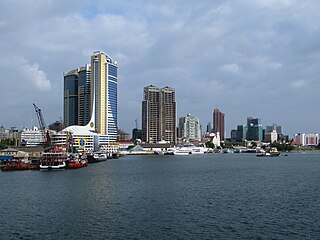
The economy of Tanzania is a lower-middle income economy that is overwhelmingly dependent on agriculture. Tanzania's economy has been transitioning from a planned economy to a market economy since 1985. Although total GDP has increased since these reforms began, GDP per capita dropped sharply at first, and only exceeded the pre-transition figure in around 2007.
The economy of Togo has struggled greatly. The International Monetary Fund (IMF) ranks it as the tenth poorest country in the world, with development undercut by political instability, lowered commodity prices, and external debts. While industry and services play a role, the economy is dependent on subsistence agriculture, with industrialization and regional banking suffering major setbacks.
The economy of Guyana is one of the fastest growing in the world with a gross domestic product (GDP) growth of 19.9% in 2021. In 2023, Guyana had a per capita gross domestic product of Int$60,648 and an average GDP growth of 4.2% over the previous decade. Guyana's economy was transformed in 2015 with the discovery of an offshore oil field in the country’s waters about 190 km from Georgetown, making the first commercial-grade crude oil draw in December 2019, sending it abroad for refining.
The economy of Mozambique is $14.396 billion by gross domestic product as of 2018, and has developed since the end of the Mozambican Civil War (1977–1992). In 1987, the government embarked on a series of macroeconomic reforms, which were designed to stabilize the economy. These steps, combined with donor assistance and with political stability since the multi-party elections in 1994, have led to dramatic improvements in the country's growth rate. Inflation was brought to single digits during the late 1990s, although it returned to double digits in 2000–02. Fiscal reforms, including the introduction of a value-added tax and reform of the customs service, have improved the government's revenue collection abilities.
The economy of Papua New Guinea (PNG) is largely underdeveloped with the vast majority of the population living below the poverty line. However, according to the Asian Development Bank its GDP is expected to grow 3.4% in 2022 and 4.6% in 2023. It is dominated by the agricultural, forestry, and fishing sector and the minerals and energy extraction sector. The agricultural, forestry, and fishing sector accounts for most of the labour force of PNG while the minerals and energy extraction sector, including gold, copper, oil and natural gas is responsible for most of the export earnings.
The economy of Algeria deals with Algeria's current and structural economic situation. Since independence in 1962, Algeria has launched major economic projects to build up a dense industrial base. However, despite these major achievements, the Algerian economy has gone through various stages of turbulence.
↑ "Country Intelligence: Report Guatemala". Guatemala Country Monitor (Business Source Premier): 1–18. 1 November 2013.
↑ Central Intelligence Agency Office of Public Affairs (4 September 2012). "The CIA World Fact Book". The Central Intelligence Agency.{{cite web}}: Missing or empty |url= (help)
1 2 3 United Nations Development Programme. Human Development Report 2011; Sustainability and Equity: A Better Future For All. New York. 2011.
1 2 3 4 5 Arends, Mary. "Female Labor Force Participation And Earnings in Guatemala." Case studies on women's employment and pay in Latin America.Washington, D.C. (1992): 273-298. EconLit. Web. 23 Sept. 2012.
1 2 International Fund for Agricultural Development (2012). "Rural Poverty Portal". International Fund for Agricultural Development – via Paolo di Dono.{{cite web}}: Missing or empty |url= (help)
↑ Goldin, Liliana (7 December 2014). "From Despair to Resistance: Maya Workers in the Maquilas of Guatemala". Anthropology of Work Review. 33 (1): 25–33. doi:10.1111/j.1548-1417.2012.01074.x.
↑ "CAFTA-DR Summary"(PDF). U.S. Customs and Border Protection. Department of Homeland Security. 24 March 2015. Archived(PDF) from the original on 13 September 2015. Retrieved 21 January 2016.
1 2 3 Dürr, Jochen (1 November 2016). "The political economy of agriculture for development today: the 'small versus large' scale debate revisited". Agricultural Economics. 47 (6): 671–681. doi:10.1111/agec.12264.
↑ Hamilton, Sarah; Fischer, Edward F. (1 September 2005). "Maya Farmers and Export Agriculture in Highland Guatemala: Implications for Development and Labor Relations". Latin American Perspectives. 32 (144): 33–58. doi:10.1177/0094582X05279503. S2CID144240335.
1 2 3 4 Hamilton, Sarah; Asturias de Barrios, Linda; Tevalán, Brenda (1 September 2001). "Gender and Commercial Agriculture in Ecuador and Guatemala". Culture & Agriculture. 23 (3): 1–12. doi:10.1525/cag.2001.23.3.1. ISSN1556-486X.
1 2 3 United Nations Development Programme. Assessment of Development Results Evaluation of UNDP Contribution Guatemala. New York. 2009.
↑ UNDP Contribution Guatemala. New York. 2009. United Nations. Achieving the Millennium Development Goals With Equality in Latin America and the Caribbean Progress and Challenges. New York. 2010.
1 2 3 Jimenez, Raul (2017). "Barriers to electrification in Latin America: Income, location, and economic development". Energy Strategy Reviews. 15: 9–18. doi:10.1016/j.esr.2016.11.001. ISSN2211-467X.
1 2 3 Grogan, Louise (2018). "Time use impacts of rural electrification: Longitudinal evidence from Guatemala". Journal of Development Economics. 135: 304–317. doi:10.1016/j.jdeveco.2018.03.005. S2CID155166026.
1 2 Taylor, Matthew J (2005). "Electrifying Rural Guatemala: Central Policy and Rural Reality". Environment and Planning C: Government and Policy. 23 (2): 173–189. doi:10.1068/c14r. ISSN0263-774X. S2CID56233492.
1 2 3 4 5 6 7 Aguilar-Støen, Mariel; Hirsch, Cecilie (2017). "Bottom-up responses to environmental and social impact assessments: A case study from Guatemala". Environmental Impact Assessment Review. 62: 225–232. doi:10.1016/j.eiar.2016.08.003.
†Physiographically, these continental islands are not part of the volcanic Windward Islands arc, although sometimes grouped with them culturally and politically.
#Bermuda is an isolated North Atlanticoceanic island, physiographically not part of the Lucayan Archipelago, Antilles, Caribbean Sea nor North American continental nor South American continental islands. It is grouped with the Northern American region, but occasionally also with the Caribbean region culturally.
This page is based on this Wikipedia article Text is available under the CC BY-SA 4.0 license; additional terms may apply. Images, videos and audio are available under their respective licenses.