Economy of Qatar

Last updated

Economy of Qatar
Doha skyline in the morning (12544910974).jpg
Currency Qatari riyal (QAR, QR)
Trade organisations
WTO and GCC
Country group
[3]
Statistics
PopulationIncrease Neutral.svg 3,098,866 (2024) [4]
GDP
  • Decrease2.svg $244.69 billion (nominal, 2024) [5]
  • Increase2.svg $337.52 billion (PPP, 2024) [5]
GDP rank
GDP growth
  • Increase2.svg 4.1% (2022) [6]
  • Decrease2.svg 1.6% (2023) [5]
  • Increase2.svg 2% (2024f) [5]
GDP per capita
  • Increase2.svg $81,400 (nominal, 2024) [5]
  • Increase2.svg $112,283 (PPP, 2024) [5]
GDP per capita rank
GDP by sector
  • agriculture: 0.2%
  • industry: 50.3%
  • services: 49.5%
  • (2017 est.)
  • Decrease Positive.svg3.1% (2023) [5]
  • Decrease Positive.svg2.6% (2024f est.) [5]
  • Increase2.svg 0.855 very high (2021) [7] (42nd)
  • N/A IHDI (2021) [8]
Labour force
Increase2.svg 2,035,269 (2023) [9]
UnemploymentSteady2.svg 0.6% (2017 est.)
Main industries
External
ExportsDecrease2.svg $86.51 billion (2018 est.)
Export goods
Liquefied natural gas, Petroleum Products, Fertilizers, Steel
Main export partners
ImportsDecrease2.svg $26.69 billion (2017 est.)
Import goods
Machinery and Transport Equipment, Food, Chemicals
Main import partners
$168 billion (31 December 2017 est.) [12]
Public finances
Decrease Positive.svg 44.5% of GDP (2022)
Revenues$297.70 billion (2022)
Expenses$208.70 billion (2022)
Main data source: CIA World Fact Book
All values, unless otherwise stated, are in US dollars.
Infrastructure in an industrial area at Doha Infrastructure in the Umm Al Houl industrial area.jpg
Infrastructure in an industrial area at Doha
Map showing the mineral resources of Qatar. Qatar Mineral map.gif
Map showing the mineral resources of Qatar.

The Economy of Qatar is one of the highest in the world based on GDP per capita, ranking generally among the top ten richest countries on world rankings for 2015 and 2016 data compiled by the World Bank, the United Nations, and the International Monetary Fund (IMF). [15] [16] The country's economy has grown despite sanctions by its neighbors, Saudi Arabia and the United Arab Emirates. Mainly because the country exports primarily to Japan, South Korea, India and China, making the sanctions effectively redundant as neither Saudi Arabia nor the United Arab Emirates have imposed trading penalties such as tariffs or embargoes on any of these countries for trading with Qatar, or offering incentives such as discounts for their own energy exports to reduce Qatari exports.

Contents

Petroleum and natural gas are the cornerstones of Qatar's economy and account for more than 70% of total government revenue, more than 60% of gross domestic product, and roughly 85% of export earnings. Qatar has the world's third largest proven natural gas reserve and is the second-largest exporter of natural gas.

Energy sector

Before the emergence of petrol-based industry, Qatar was a poor pearl diving country. The exploration of oil and gas fields began in 1939. [17] [18] In 1973, oil production and revenues increased dramatically, moving Qatar out of the ranks of the world's poorest countries and providing it with one of the highest per capita incomes in the world.

Qatar's economy was in a downturn from 1982 to 1989. OPEC (Organization of Petroleum Exporting Countries) quotas on crude oil production, the lower price for oil, and the generally unpromising outlook on international markets reduced oil earnings. In turn, the Qatari government's spending plans had to be cut to match lower income. The resulting recessionary local business climate caused many firms to lay off expatriate staff. With the economy recovering in the 1990s, expatriate populations, particularly from Egypt and South Asia, have grown again.

Oil production will not long remain at peak levels of 500,000 barrels (80,000 m³) per day, as oil fields are projected to be mostly depleted by 2023. However, large natural gas reserves have been located off Qatar's northeast coast. These offshore gas fields also may contain significant oil and condensate reserves. For example, the state owned QatarEnergy corporation found two offshore oil fields in the 1960s. At the time production was too expensive. However, technological development led to production over 30 years later.

The gas condensate can be refined to usual oil products in specialised refineries. The costs are a bit higher but it is normal today for companies to use the gas condensate too. Oil offshore production in 2008 for PS-2 and PS-3 blocks was about 31.1 million barrels (84,995 b/d). Joint Ventures facilities (PS-1, ALK, K & A): Combined oil production from these three joint venture production facilities in 2008 was 57.4 million barrels (156,873 b/d). [19] Like with gas fields there are more offshore blocks which need to be explored and could increase the oil output. So the 500,000 bpd peak and a depletion in 2023 is delayed. With higher oil prices it is expected that the offshore exploration of oil and/or natural gas fields will go on. Oil production in June 2016 seemed to be around 670,000 barrels per day, a bit down from February 2016 production of 692,000 barrels per day. Taking all liquids together Qatar is already far beyond a million barrels per day.

Qatar's proved reserves of gas are the third-largest in the world, exceeding 7000 km3 (250 trillion cubic feet). The economy was boosted in 1991 by completion of the $1.5-billion Phase I of North Field gas development. In 1996, the Qatargas project began exporting liquefied natural gas (LNG) to Japan. Further phases of North Field gas development costing billions of dollars are in various stages of planning and development.

Qatar's heavy industrial projects, all based in Umm Said, include a refinery with a 50,000 barrels (8,000 m³) per day capacity, a fertilizer plant for urea and ammonia, a steel plant, and a petrochemical plant. All these industries use gas for fuel. Most are joint ventures between European and Japanese firms and the state-owned QatarEnergy corporation (formerly QGPC). The U.S. is the major equipment supplier for Qatar's oil and gas industry, and U.S. companies are playing a major role in North Field gas development. 890- Qatar pursues a vigorous program of "Qatarization", under which all joint venture industries and government departments strive to move Qatari nationals into positions of greater authority. Growing numbers of foreign-educated Qataris, including many educated in the U.S., are returning home to assume key positions formerly occupied by expatriates. In order to control the influx of expatriate workers, Qatar has tightened the administration of its foreign manpower programs over the past several years. Security is the principal basis for Qatar's strict entry and immigration rules and regulations.

Industry

The government considers industry to be an integral part of its plan to diversify the economy and maximize its huge natural gas reserves, which serve as the primary feed stock for the sector. Accordingly, careful planning has gone into industrial development. With an eye towards exports, development has been clustered around the ports of Ras Laffan Industrial City and Mesaieed Industrial Area, which are key centers of energy. The result has seen considerable growth over the years. Industries Qatar (IQ), a producer of petrochemicals, fertilizers and steel, is a regional powerhouse, surpassed only in size by Saudi Basic Industries Corporation (SABIC), the Middle East's largest chemical producer. In 2007 the manufacturing sector made the third-largest contribution to GDP among non-oil and gas sectors, equivalent to about 7.5% of GDP. Industry in Qatar is regulated by the Ministry of Business and Trade. [20]

Petrochemicals and fertilizers supply make up a large portion of the industrial base, along with steel and other construction materials, through Qatar Steel and Qatar Primary Material Company (QPMC). Indeed, over the past few years, demand for construction materials experienced a major surge as the development boom swept the Persian Gulf region. But the global financial crisis has put a significant dent in demand in the region, as project credit lines dry up and investor sentiment remains cautious. The crisis has in fact impacted the whole of the industrial sector – IQ saw its net profit drop in the fourth quarter of 2008 more than 90% over the same period the previous year. But in relative terms, the sector has fared better than most and IQ still managed to post an annual profit of $2bn. Large profit chunks from years past have been channeled into capital investments, which should help the sector ride out the storm. IQ, for example, is pushing several major expansion projects, worth almost $6bn, ahead.

North Field LNG project

On 8 February 2021, the world's largest LNG supplier, Qatar Petroleum (now QatarEnergy), signed an EPC-contract with Chiyoda and Technip for the North Field East (NFE) expansion project to increase QE's annually LNG output by 40% until 2026. [21] For the $28.7 billion NFE expansion project, QatarEnergy has partnered with five global energy companies that have acquired 25% stake in the project. These include Shell, TotalEnergies and ExxonMobil, each with 6.25%, and Eni and ConocoPhillips, each with 3.125% stakes. In a first phase, LNG export capacity is expected to increase from 77 million tons per year to 110 million tons per year by 2026. [22] [23]

On 20 June 2022, Minister of State for Energy Saad Sherida Al-Kaabi said at a press conference at the QatarEnergy that the expected production increase from this project will be 32.6 million tonnes annually. Ethane produced from the project would be 1.5 million tonnes per year, LPG 4 million tonnes per year, 250.000 barrels of condensate and 5.000 tonnes of helium per day. [24] [25]

In a second phase, the North Field South (NFS) project, Shell and TotalEnergies have each acquired 9.375% and ConocoPhillips 6.25% stakes. QatarEnergy plans to increase LNG production with the NFS project to 126 million tons per year beginning in 2028. [26]

In April 2023, Sinopec acquired a 5% stake in an 8 million tonnes per year LNG train. [27]

Financial sector

The Qatari banking sector managed to escape the direct impact of the global subprime fallout, but was not altogether unscathed by its aftershocks. Overall, it was the best performing of the Gulf Cooperation Council markets in the last quarter of 2008 and most banks posted substantial profits for 2008. But the sector is also facing issues of liquidity, declining customer confidence and a forced reluctance to lend. In a bid to strengthen the banks’ positions, the Qatar Investment Authority (QIA) announced in early 2009 that it was willing to take a 10-20% stake in any interested local listed banks by way of a capital injection, although this was later reduced to 5% stakes and an additional 5% at the end of 2009. [28]

The Qatari government also announced in March 2009 that it was planning to buy the investment portfolio of the banks in the hope this would encourage them to continue lending. Cautious sector sentiment has also been compounded by the Qatar Central Bank's (QCB's) lending restrictions, which demand a loan-to-deposit ratio of 90%. Given the high level of integration between Qatar's economy and the Persian Gulf region, as well as the wider world, a slowdown in business and banking activity seemed inevitable. Nevertheless, Qatar's banking sector has been faring relatively well, considering the strife experienced in other countries, and insiders are confident that activity will return to its previous brisk pace in the second half of 2009 as confidence slowly rebuilds around the globe.

The International Monetary Fund in its spring assessment 2019 said that Qatar has "successfully absorbed the shocks" of the blockade imposed in 2017 and the dropped oil prices from 2014 to 2016. S&P Global had marked Qatar's outlook to negative in 2017, but changed it to stable in 2019. [29]

In August 2019, Qatar Central Bank stated that the country's economic growth will see a boost over the next two years amid expectations of stable oil prices and continued strong exports. The GDP is expected to grow at an average rate of 2.8% between 2018 and 2020, with the budget surplus falling to 4.35 billion riyals in 2019, from a surplus of 15.1 billion riyals in 2018. [30]

Qatar's GDP is anticipated to scale up to $208 billion in 2024 from $162 billion in 2022, according to a report by FocusEconomics. [31] The World Bank has projected Qatar's economy to be the fastest growing in the GCC in 2023 and 2024. [32]

Islamic finance

The Islamic finance sector enjoyed increased activity in 2008 and is expected to continue to grow into 2009 as more sophisticated financial instruments spark the interest of investors. In addition to Islamic banks, such as Qatar Islamic Bank (QIB), Qatar International Islamic Bank (QIIB) and newcomer Masraf Al Rayyan, conventional banks have also been entering the sharia-compliant sector and are coming to view an Islamic subsidiary as a virtual necessity in order to maintain market standing. Islamic banks currently take the lion's share of sharia-compliant business, though the conventional banks are working hard to take a greater share of market activity. Both Islamic banks and Islamic subsidiaries did remarkably well in the first three quarters of 2008, during which overall financing activity increased by 70.6% compared to the same period in the previous year. The global financial crisis slowed this growth though. Poor market conditions have contributed to a marked slowdown of Islamic bond, or sukuk, activity in 2008 throughout the Persian Gulf. But other segments, such as Islamic insurance, or takaful, have not seen a similar downturn. Overall, challenges to further growth remain, including a lack of qualified staff to meet the growing demand for sharia-compliant banking services. [33]

Capital market

The stock market capitalisation of listed companies in Qatar was valued at $95,487 million in 2007 by the World Bank. [34] As 2008 drew to a close, no capital markets around the globe, including Qatar's, were immune to the effects of the sub-prime fallout. That said, there is considerable optimism that Qatar's bourse, the Doha Securities Market (DSM), will remain relatively resilient to the ongoing international turbulence. It has followed the same peak-trough trajectory as many others around the globe, hitting record highs in mid-2008, before diving in late 2008 and early 2009. Between December 2006 and July 2008 the DSM Index rose about 117% before the global financial crisis wiped out most of these gains. In the first few months of 2009, the DSM lost about 40% of its value. In an effort to stave off further losses, the government announced in February 2009 that it would step in to buy up shares of troubled banks amounting to about 10% of the market's capitalisation. The move improved investor optimism and is hoped to prevent the market from falling further. The proposal to create a single unified regulator as early as 2010 to oversee all banking and financial services is viewed as another promising development that will transform the financial sector for the better.

Travel and tourism

The Pearl Qatar Pearl-Qatar Doha Qatar 11Nov2017 SkySat.jpg
The Pearl Qatar

Under the ambitious five-year development plan of the Qatar Tourism and Exhibitions Authority (QTEA), the government aimed to boost the number of visitors from 964,000 as of 2007 to 1.5m by 2010. [35] The funding required to meet this goal was present in sufficient amounts; in 2008 the state allocated some $17bn for tourism development through 2014, most of which was allocated towards hotels, exhibition space and infrastructure. In order to keep up with a rising number of visitors, the government set a goal of increasing hotel capacity 400% by 2012. [36] In addition to financial support, the government has also worked to ease business regulations in a bid to increase private sector activity. A major aspect of expansion plans is the Hamad International Airport, which has the capacity to handle up to 24m passengers. [37]

Qatar Airways is an airline owned by the Qatar government and was founded in 1993. It travels to over a hundred destinations.

Other niche tourism segments receiving special focus include cultural tourism on the back of the high publicity opening of Doha's Museum of Islamic Art, and sports tourism, initially spurred by the Asian Games, to which Qatar played host in 2006. Qatar hosted the 2022 FIFA World cup, [38] [39]

Transport

Highway Q3 (from Doha to Dukhan) Qatar, Dukhan Highway.JPG
Highway Q3 (from Doha to Dukhan)

With a fast-expanding population and substantial economic growth over the past decade, a reliable and extensive transportation network is becoming increasingly necessary within Qatar. So far the government, the primary transport developer, has done well in terms of keeping up with demand for new transportation options. In 2008 the Public Works Authority (Ashghal), one of the bodies that oversees infrastructure development, underwent a major reorganisation in order to streamline and modernise the authority in preparation for major project expansions across all segments in the near future. Ashghal works in tandem with the Urban Planning and Development Authority (UPDA), the body that designed the transportation master plan, instituted in March 2006 and running to 2025.[ citation needed ]

Scene in the harbour of Al Khor. Fisheries is a minor sector in Qatar, and production is almost exclusively for domestic consumption. Qatar, Al Khor (10), harbour, offloading fish.JPG
Scene in the harbour of Al Khor. Fisheries is a minor sector in Qatar, and production is almost exclusively for domestic consumption.

As driving is the primary mode of transport in Qatar, the road network is a major focus of the plan. Project highlights in this segment include the multibillion-dollar Doha Expressway and the Qatar Bahrain Causeway, which will connect Qatar to Bahrain and Saudi Arabia and is considered a milestone in regional interconnectivity. Mass-transit options, such as a Doha metro, light-rail system and more extensive bus networks, are also under development to ease road congestion. In addition, the railway system is being significantly expanded and could eventually form an integral part of a GCC-wide network linking all of the six member states. The airport, too, is expanding capacity to keep up with rising visitor numbers. The New Doha International Airport is one of the largest projects in Qatar today and will boast a capacity of 50m passengers upon completion in 2015. Finally, port infrastructure is seen as an integral part of Qatar's economic development as it focuses on LNG and industrial exports. The port at Mesaieed is undergoing expansion. While the financial crisis may present challenges to infrastructure development, once all projects are completed Qatar will have one of the most advanced and modern transport infrastructures in the region.[ citation needed ]

Macro-economic trend

Qatar is now among the richest countries in the world, on a per person basis. [40] Current GDP per capita registered a world record-breaking peak growth of 1,156% in the 70s. [41] This became quickly unsustainable and Qatar's current GDP per capita contracted 53% in the 80s. But rising global oil demand helped current GDP per capita to expand 94% in the 90s. Despite efforts to promote the non-hydrocarbon sectors and diversify the economy from hydrocarbons to knowledge-based sectors, the oil and gas sector has consistently contributed to at least 80 percent of the government of Qatar’s total revenues since 2014, as well as 90 percent of Qatar’s total exports. [42]

In 2020 GDP PPP ~260 billion dollars. [43]

This table is of Qatar's gross domestic product at market prices as estimated by the International Monetary Fund with figures in millions of Qatari Rials. [44]

YearGross Domestic ProductUS Dollar ExchangeInflation Index
(2000=100)
Per Capita Income
(as % of USA)
198028,6313.65 Qatari Riyals53266.18
198522,8293.63 Qatari Riyals64104.82
199026,7923.64 Qatari Riyals7767.85
199529,6223.63 Qatari Riyals8555.75
200064,6463.63 Qatari Riyals10086.03
2005137,7843.64 Qatari Riyals115127.05

For purchasing power parity comparisons only, the US Dollar is exchanged at 3.67 Qatari Riyals. Mean wages were $59.99 per man-hour in 2009.

In February 2012, the International Bank of Qatar reported that GDP grew by 19.9% in 2011, but estimated that 2012 growth would slow to 9.8% [45]

The following table shows the main economic indicators in 1980–2017. Inflation below 2% is in green. [46]

YearGDP
(in Bil. US$ PPP)
GDP per capita
(in US$ PPP)
GDP
(in Bil. US$ nominal)
GDP growth
(real)
Inflation rate
(in Percent)
Government debt
(in % of GDP)
198017.6372,0616.7Decrease2.svg−1.0 %Increase Negative.svg6.8 %n/a
1981Increase2.svg18.5Decrease2.svg69,897Increase2.svg7.4Decrease2.svg−3.9 %Increase Negative.svg8.5 %n/a
1982Decrease2.svg18.1Decrease2.svg63,271Decrease2.svg6.5Decrease2.svg−8.2 %Increase Negative.svg5.7 %n/a
1983Decrease2.svg17.8Decrease2.svg58,114Decrease2.svg5.5Decrease2.svg−5.3 %Increase Negative.svg2.7 %n/a
1984Increase2.svg21.3Increase2.svg65,435Increase2.svg5.7Increase2.svg16.0 %Increase2.svg1.1 %n/a
1985Decrease2.svg19.2Decrease2.svg55,602Decrease2.svg5.3Decrease2.svg−13.0 %Increase2.svg1.1 %n/a
1986Increase2.svg20.3Increase2.svg56,008Decrease2.svg4.2Increase2.svg3.7 %Increase2.svg1.9 %n/a
1987Increase2.svg21.0Decrease2.svg55,604Increase2.svg4.4Increase2.svg0.9 %Increase Negative.svg4.5 %n/a
1988Increase2.svg22.7Increase2.svg57,909Decrease2.svg4.3Increase2.svg4.7 %Increase Negative.svg4.5 %n/a
1989Increase2.svg24.9Increase2.svg60,973Increase2.svg4.5Increase2.svg5.3 %Increase Negative.svg4.8 %n/a
1990Decrease2.svg22.0Decrease2.svg46,184Increase2.svg6.3Decrease2.svg−14.6 %Increase Negative.svg3.3 %10.7 %
1991Increase2.svg22.4Decrease2.svg46,095Decrease2.svg5.6Decrease2.svg−1.7 %Increase Negative.svg3.0 %Increase Negative.svg17.6 %
1992Increase2.svg25.5Increase2.svg52,008Increase2.svg6.4Increase2.svg11.3 %Increase Negative.svg4.4 %Decrease Positive.svg16.6 %
1993Increase2.svg25.7Increase2.svg52,284Decrease2.svg5.8Decrease2.svg−1.3 %Decrease Positive.svg−0.9 %Increase Negative.svg37.5 %
1994Increase2.svg26.6Increase2.svg53,814Increase2.svg5.9Increase2.svg1.4 %Increase2.svg1.5 %Increase Negative.svg44.2 %
1995Increase2.svg27.9Increase2.svg55,576Increase2.svg6.9Increase2.svg2.4 %Increase Negative.svg3.0 %Decrease Positive.svg42.3 %
1996Increase2.svg29.6Increase2.svg57,761Increase2.svg7.8Increase2.svg4.4 %Increase Negative.svg7.0 %Increase Negative.svg49.5 %
1997Increase2.svg39.1Increase2.svg73,926Increase2.svg10.0Increase2.svg30.0 %Increase Negative.svg2.7 %Decrease Positive.svg48.0 %
1998Increase2.svg44.0Increase2.svg79,960Decrease2.svg8.5Increase2.svg11.2 %Increase2.svg2.8 %Increase Negative.svg63.4 %
1999Increase2.svg46.6Increase2.svg81,438Increase2.svg11.3Increase2.svg4.3 %Increase Negative.svg2.2 %Increase Negative.svg74.4 %
2000Increase2.svg51.5Increase2.svg86,713Increase2.svg18.1Increase2.svg8.0 %Increase2.svg1.6 %Decrease Positive.svg52.5 %
2001Increase2.svg54.7Increase2.svg89,419Decrease2.svg17.5Increase2.svg4.0 %Increase2.svg1.6 %Increase Negative.svg59.1 %
2002Increase2.svg59.5Increase2.svg94,540Increase2.svg19.3Increase2.svg2.5 %Increase2.svg0.2 %Decrease Positive.svg47.6 %
2003Increase2.svg63.0Increase2.svg95,393Increase2.svg23.7Increase2.svg3.7 %Increase Negative.svg2.2 %Decrease Positive.svg39.0 %
2004Increase2.svg77.2Increase2.svg107,098Increase2.svg30.7Increase2.svg19.2 %Increase Negative.svg6.8 %Decrease Positive.svg29.0 %
2005Increase2.svg85.6Decrease2.svg104,243Increase2.svg44.6Increase2.svg7.5 %Increase Negative.svg8.9 %Decrease Positive.svg19.2 %
2006Increase2.svg111.3Increase2.svg115,048Increase2.svg58.6Increase2.svg26.2 %Increase Negative.svg11.8 %Decrease Positive.svg13.4 %
2007Increase2.svg134.8Increase2.svg117,000Increase2.svg76.0Increase2.svg18.0 %Increase Negative.svg13.7 %Decrease Positive.svg8.9 %
2008Increase2.svg161.8Decrease2.svg104,116Increase2.svg112.6Increase2.svg17.7 %Increase Negative.svg15.1 %Increase Negative.svg11.1 %
2009Increase2.svg182.5Increase2.svg111,364Decrease2.svg88.2Increase2.svg12.0 %Decrease Positive.svg−4.9 %Increase Negative.svg32.4 %
2010Increase2.svg218.2Increase2.svg127,226Increase2.svg119.7Increase2.svg18.1 %Decrease Positive.svg−2.4 %Decrease Positive.svg29.1 %
2011Increase2.svg252.5Increase2.svg145,724Increase2.svg167.8Increase2.svg13.4 %Increase2.svg2.0 %Increase Negative.svg33.5 %
2012Increase2.svg269.2Increase2.svg146,872Increase2.svg186.8Increase2.svg4.9 %Increase2.svg1.8 %Decrease Positive.svg32.1 %
2013Increase2.svg285.6Decrease2.svg142,543Increase2.svg198.7Increase2.svg4.4 %Increase Negative.svg3.2 %Decrease Positive.svg30.9 %
2014Increase2.svg302.3Decrease2.svg136,409Increase2.svg206.2Increase2.svg4.0 %Increase Negative.svg3.4 %Decrease Positive.svg24.9 %
2015Increase2.svg316.4Decrease2.svg129,805Decrease2.svg161.7Increase2.svg3.6 %Increase2.svg1.8 %Increase Negative.svg34.9 %
2016Increase2.svg327.6Decrease2.svg125,159Decrease2.svg151.7Increase2.svg2.2 %Increase Negative.svg2.7 %Increase Negative.svg46.5 %
2017Increase2.svg340.6Decrease2.svg124,529Increase2.svg161.1Increase2.svg2.1 %Increase2.svg0.4 %Increase Negative.svg54.0 %

According to the International Monetary Fund, Qatar's economic performance improved in 2018 despite the economic embargo. The GDP growth is expected to increase to 2.6% in 2019 from 2.2% in 2018. [47]

Related Research Articles

<span class="mw-page-title-main">Economy of Brunei</span>

The economy of Brunei, a small and wealthy country, is a mixture of foreign and domestic entrepreneurship, government regulation and welfare measures, and village traditions. It is almost entirely supported by exports of crude oil and natural gas, with revenues from the petroleum sector accounting for over half of GDP. Per capita GDP is high, and substantial income from overseas investment supplements income from domestic production. The government provides for all medical services and subsidizes food and housing. The government has shown progress in its basic policy of diversifying the economy away from oil and gas. Brunei's leaders are concerned that steadily increased integration in the world economy will undermine internal social cohesion although it has taken steps to become a more prominent player by serving as chairman for the 2000 APEC forum. Growth in 1999 was estimated at 2.5% due to higher oil prices in the second half.

<span class="mw-page-title-main">Economy of Equatorial Guinea</span>

The economy of Equatorial Guinea has traditionally been dependent on commodities such as cocoa and coffee, but is now heavily dependent on petroleum due to the discovery and exploitation of significant oil reserves in the 1980s. In 2017, it graduated from "Least Developed Country" status, one of six Sub-Saharan African nations that managed to do so.

<span class="mw-page-title-main">Economy of Jordan</span>

The economy of Jordan is classified as an emerging market economy. Jordan's GDP per capita rose by 351% in the 1970s, declined 30% in the 1980s, and rose 36% in the 1990s. After King Abdullah II's accession to the throne in 1999, liberal economic policies were introduced. Jordan's economy had been growing at an annual rate of 8% between 1999 and 2008. However, growth has slowed to 2% after the Arab Spring in 2011. The substantial increase of the population, coupled with slowed economic growth and rising public debt led to a worsening of poverty and unemployment in the country. As of 2019, Jordan has a GDP of US$44.4 billion, ranking it 89th worldwide.

<span class="mw-page-title-main">Economy of Kyrgyzstan</span>

The economy of Kyrgyzstan is heavily dependent on the agricultural sector. Cotton, tobacco, wool, and meat are the main agricultural products, although only tobacco and cotton are exported in any quantity. According to Healy Consultants, Kyrgyzstan's economy relies heavily on the strength of industrial exports, with plentiful reserves of gold, mercury and uranium. The economy also relies heavily on remittances from foreign workers. Following independence, Kyrgyzstan was progressive in carrying out market reforms, such as an improved regulatory system and land reform. In 1998, Kyrgyzstan was the first Commonwealth of Independent States (CIS) country to be accepted into the World Trade Organization. Much of the government's stock in enterprises has been sold. Kyrgyzstan's economic performance has been hindered by widespread corruption, low foreign investment and general regional instability. Despite those issues, Kyrgyzstan is ranked 70th on the ease of doing business index.

<span class="mw-page-title-main">Economy of Libya</span>

The economy of Libya depends primarily on revenues from the petroleum sector, which represents over 95% of export earnings and 60% of GDP. These oil revenues and a small population have given Libya one of the highest nominal per capita GDP in Africa.

<span class="mw-page-title-main">Economy of Niger</span>

The gross domestic product (GDP) of Niger was $16.617 billion US dollars in 2023, according to official data from the World Bank. This data is based largely on internal markets, subsistence agriculture, and the export of raw commodities: foodstuffs to neighbors and raw minerals to world markets. Niger, a landlocked West African nation that straddles the Sahel, has consistently been ranked on the bottom of the Human Development Index, at 0.394 as of 2019. It has a very low per capita income, and ranks among the least developed and most heavily indebted countries in the world, despite having large raw commodities and a relatively stable government and society not currently affected by civil war or terrorism. Economic activity centers on subsistence agriculture, animal husbandry, re-export trade, and export of uranium.

<span class="mw-page-title-main">Economy of Oman</span>

The economy of Oman is mainly centered around its oil sector, with fishing and trading activities located around its coastal regions. When oil was discovered in 1964, the production and export increased significantly. The government has made plans to diversify away from oil under its privatization and Omanization policies. This has helped raise Oman's GDP per capita continuously in the past 50 years. It grew 339% in the 1960s, reaching a peak growth of 1,370% in the 1970s. Similar to the pricing of all other commodities, the price of oil is subject to significant fluctuations over time, especially those associated with the business cycle. A commodity's price will rise sharply when demand, like that for oil, outpaces supply; meanwhile, when supply outpaces demand, prices will fall.

<span class="mw-page-title-main">Economy of Pakistan</span>

The economy of Pakistan is categorized as a developing economy. It ranks as the 24th-largest based on GDP using purchasing power parity (PPP) and the 46th largest in terms of nominal GDP. With a population of 241.5 million people as of 2023, Pakistan’s position at per capita income ranks 161st by GDP (nominal) and 138th by GDP (PPP) according to the International Monetary Fund (IMF).

<span class="mw-page-title-main">Economy of Tanzania</span>

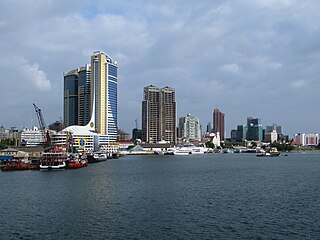
The economy of Tanzania is a lower-middle income economy that is overwhelmingly dependent on agriculture. Tanzania's economy has been transitioning from a planned economy to a market economy since 1985. Although total GDP has increased since these reforms began, GDP per capita dropped sharply at first, and only exceeded the pre-transition figure in around 2007.

<span class="mw-page-title-main">Economy of Trinidad and Tobago</span>

The economy of Trinidad and Tobago is the third wealthiest in the Caribbean and the fifth-richest by GDP (PPP) per capita in the Americas. Trinidad and Tobago is recognised as a high-income economy by the World Bank. Unlike most of the English-speaking Caribbean, the country's economy is primarily industrial, with an emphasis on petroleum and petrochemicals. The country's wealth is attributed to its large reserves and exploitation of oil and natural gas.

<span class="mw-page-title-main">Economy of Ukraine</span>

The economy of Ukraine is an emerging, lower-middle income, mixed economy located in Eastern Europe. It grew rapidly from 2000 until 2008 when the Great Recession began worldwide and reached Ukraine. The economy recovered in 2010 and continued improving until 2013. From 2014 to 2015, the Ukrainian economy suffered a severe downturn, with GDP in 2015 being slightly above half of its value in 2013. In 2016, the economy again started to grow. By 2018, the Ukrainian economy was growing rapidly, and reached almost 80% of its size in 2008.

<span class="mw-page-title-main">Economy of Yemen</span>

The economy of Yemen has significantly weakened since the breakout of the Yemeni Civil War and the humanitarian crisis, which has caused instability, escalating hostilities, and flooding in the region. At the time of unification, South Yemen and North Yemen had vastly different but equally struggling underdeveloped economic systems. Since unification, the economy has been forced to sustain the consequences of Yemen's support for Iraq during the 1990–91 Persian Gulf War: Saudi Arabia expelled almost 1 million Yemeni workers, and both Saudi Arabia and Kuwait significantly reduced economic aid to Yemen. The 1994 civil war further drained Yemen's economy. As a consequence, Yemen has relied heavily on aid from multilateral agencies to sustain its economy for the past 24 years. In return, it has pledged to implement significant economic reforms. In 1997 the International Monetary Fund (IMF) approved two programs to increase Yemen's credit significantly: the enhanced structural adjustment facility and the extended funding facility (EFF). In the ensuing years, Yemen's government attempted to implement recommended reforms: reducing the civil service payroll, eliminating diesel and other subsidies, lowering defense spending, introducing a general sales tax, and privatizing state-run industries. However, limited progress led the IMF to suspend funding between 1999 and 2001.

<span class="mw-page-title-main">Economy of Bahrain</span>

The economy of Bahrain is heavily dependent upon oil and gas. The Bahraini Dinar is the second-highest-valued currency unit in the world. Since the late 20th century, Bahrain has heavily invested in the banking and tourism sectors. The country's capital, Manama is home to many large financial structures. Bahrain's finance industry is very successful. In 2008, Bahrain was named the world's fastest growing financial center by the City of London's Global Financial Centres Index. Bahrain's banking and financial services sector, particularly Islamic banking, have benefited from the regional boom driven by demand for oil. Petroleum is Bahrain's most exported product, accounting for 60% of export receipts, 70% of government revenues, and 11% of GDP. Aluminium is the second most exported product, followed by finance and construction materials.

<span class="mw-page-title-main">Economy of the Middle East</span>

The economy of the Middle East is very diverse, with national economies ranging from hydrocarbon-exporting rentiers to centralized socialist economies and free-market economies. The region is best known for oil production and export, which significantly impacts the entire region through the wealth it generates and through labor utilization. In recent years, many of the countries in the region have undertaken efforts to diversify their economies.

The South Pars/North Dome field is a natural-gas condensate field located in the Persian Gulf. It is by far the world's largest natural gas field, with ownership of the field shared between Iran and Qatar. According to the International Energy Agency (IEA), the field holds an estimated 1,800 trillion cubic feet of in-situ natural gas and some 50 billion barrels of natural gas condensates. On the list of natural gas fields it has almost as much recoverable reserves as all the other fields combined. It has significant geostrategic influence.

<span class="mw-page-title-main">QatarEnergy</span> Qatari state-owned oil company

QatarEnergy, formerly Qatar Petroleum (QP), is a state owned petroleum company of Qatar. The company operates all oil and gas activities in Qatar, including exploration, production, refining, transport, and storage. The President & CEO is Saad Sherida al-Kaabi, Minister of State for Energy Affairs. The company's operations are directly linked with state planning agencies, regulatory authorities, and policy making bodies. Together, revenues from oil and natural gas amount to 60% of the country's GDP. As of 2018 it was the third largest oil company in the world by oil and gas reserves. In 2022, the company had total revenues of US$52bn, a net income of US42.4bn, and total assets of US$162bn. In 2021, QatarEnergy was the fifth largest gas company in the world.

<span class="mw-page-title-main">Economy of Algeria</span>

The economy of Algeria deals with Algeria's current and structural economic situation. Since independence in 1962, Algeria has launched major economic projects to build up a dense industrial base. However, despite these major achievements, the Algerian economy has gone through various stages of turbulence.

<span class="mw-page-title-main">Natural gas in Qatar</span>

The natural gas in Qatar covers a large portion of the world supply of natural gas. According to the Oil & Gas Journal, as of January 1, 2011, reserves of natural gas in Qatar were measured at approximately 896 trillion cubic feet ; this measurement means that the state contains 14% of all known natural-gas reserves, as the world's third-largest reserves, behind Russia and Iran. The majority of Qatar's natural gas is located in the massive offshore North Field, which spans an area roughly equivalent to Qatar itself. A part of the world's largest non-associated, natural-gas field, the North Field, is a geological extension of Iran's South Pars / North Dome Gas-Condensate field, which holds an additional 450 trillion cubic feet of recoverable natural-gas reserves.

<span class="mw-page-title-main">Petroleum industry in Iran</span> Overview of the petroleum industry of Iran

Iran is an energy superpower and the petroleum industry in Iran plays an important part in it. In 2004, Iran produced 5.1 percent of the world's total crude oil, which generated revenues of US$25 billion to US$30 billion and was the country's primary source of foreign currency. At 2006 levels of production, oil proceeds represented about 18.7% of gross domestic product (GDP). However, the importance of the hydrocarbon sector to Iran's economy has been far greater. The oil and gas industry has been the engine of economic growth, directly affecting public development projects, the government's annual budget, and most foreign exchange sources.

<span class="mw-page-title-main">Energy in Qatar</span>

Energy in Qatar describes energy production, consumption, and policies of the State of Qatar. The International Monetary Fund ranked Qatar as having the fifth highest GDP per capita in 2016 with a 60,787 USD per capita nominal GDP over a population of 2.421 million inhabitants. In 2014, oil and natural gas production made up 51.1% of Qatar's nominal GDP. Thus, Qatar has a worldwide high ranking of per capita GDP due to its significance production and exports in both crude oil and natural gas in proportion to its relatively small population.

References

https://www.worlddata.info/asia/qatar/index.php#:~:text=With%20a%20Human%20Development%20Index,richest%20countries%20in%20the%20world.

  1. "World Economic and Financial Surveys World Economic Outlook Database—WEO Groups and Aggregates Information April 2020". IMF.org. International Monetary Fund. Archived from the original on 22 December 2019. Retrieved 9 September 2020.
  2. "World Bank Country and Lending Groups". World Bank . Retrieved 13 February 2024.
  3. "Qatar: Country data and statistics". datahelpdesk.worldbank.org. Retrieved 29 September 2019.
  4. "Monthly Figures on Total Population". psa.gov.qa. Planning and Statistics Authority. Retrieved 15 August 2023.
  5. 1 2 3 4 5 6 7 8 "World Economic Outlook Database, April 2024". IMF.org. International Monetary Fund . Retrieved 4 May 2024.
  6. "Real Estate Market Review, Qatar Q1 2023" (PDF). cushmanwakefield.qa. Cushman & Wakefield . Retrieved 18 August 2023.
  7. "Human Development Index (HDI)". hdr.undp.org. HDRO (Human Development Report Office) United Nations Development Programme . Retrieved 4 December 2022.
  8. Nations, United. "Inequality-adjusted Human Development Index (IHDI)". hdr.undp.org. HDRO (Human Development Report Office) United Nations Development Programme . Retrieved 4 December 2022.
  9. "Labor force, total - Qatar". data.worldbank.org. World Bank. Retrieved 23 January 2020.
  10. "Export Partners of Qatar". The Observatory of Economic Complexity. 2019. Retrieved 19 June 2021.
  11. "Import Partners of Qatar". The Observatory of Economic Complexity. 2019. Retrieved 19 June 2021.
  12. "The World Factbook" . Retrieved 9 March 2018.
  13. "Sovereigns rating list". Standard & Poor's. Retrieved 26 May 2011.
  14. 1 2 Rogers, Simon; Sedghi, Ami (15 April 2011). "How Fitch, Moody's and S&P rate each country's credit rating". The Guardian. Retrieved 28 May 2011.
  15. "GDP per capita (current US$) | Data". data.worldbank.org. Retrieved 13 September 2017.
  16. "Report for Selected Countries and Subjects". www.imf.org. Retrieved 13 September 2017.
  17. "The Qatar Oil Discoveries, Rasoul Sorkhabi, Ph.D., in GEO ExPro Magazine, Vol. 7, No. 1 - 2010". January 2010.
  18. "Qatar tourist information guide" . Retrieved 14 February 2012.
  19. "Oil and Gas Details". www.qp.com.qa. Archived from the original on 11 November 2020. Retrieved 5 September 2016.
  20. "وزير التجارة و الصناعة". مكتب الاتصال الحكومي (in Arabic). Retrieved 21 May 2020.
  21. "Qatar Petroleum signs deal for mega-LNG expansion". Reuters. 8 February 2021. Retrieved 16 June 2023.
  22. Dahan, Maha El (12 June 2022). "QatarEnergy signs deal with TotalEnergies for North Field East project". Reuters. Retrieved 16 June 2023.
  23. "QatarEnergy, ConocoPhillips tie up for LNG expansion project | Hellenic Shipping News Worldwide". www.hellenicshippingnews.com. Retrieved 16 June 2023.
  24. John, Pratap (22 June 2022). "QatarEnergy joins hands with four global majors in North Field LNG expansion project". Gulf Times. Retrieved 16 June 2023.
  25. "Qatar Petroleum signs deal for mega-LNG expansion". Reuters. 8 February 2021. Retrieved 16 June 2023.
  26. Dahan, Maha El; Mills, Andrew (12 April 2023). "China's Sinopec to take stake in Qatar's North Field East". Reuters. Retrieved 16 June 2023.
  27. "Sinopec to join QatarEnergy's $29bn North Field East expansion project" . Retrieved 16 June 2023.
  28. ""Doing Business in Qatar"" (PDF).
  29. "How Qatar's cows show the growing resistance to a Saudi-led boycott". The Washington Post. Retrieved 21 July 2019.
  30. "Qatar says economic growth to accelerate in 2019-2020". Reuters. Archived from the original on 15 August 2019. Retrieved 15 August 2019.
  31. John, Pratap (10 October 2020). "Qatar GDP may scale up to $208bn in 2024: FocusEconomics". Gulf Times. Retrieved 24 March 2024.
  32. Newspaper, The Peninsula (12 June 2022). "Qatar's economy to be fastest growing in GCC in 2023, 2024". thepeninsulaqatar.com. Retrieved 24 March 2024.
  33. online, IMF Survey. "IMF Survey: Islamic Banks: More Resilient to Crisis?". IMF. Retrieved 3 April 2024.
  34. "Data - Finance". 5 December 2006. Archived from the original on 5 December 2006.{{cite web}}: CS1 maint: bot: original URL status unknown (link)
  35. "Qatar Tourism". www.visit-qatar.com. Retrieved 11 July 2023.
  36. "Global Finance Magazine declares Qatar richest country in the region". www.wsnclinic.com. Retrieved 18 August 2023.
  37. "Hamad International Airport Terminal Expansion, Doha". Airport Technology. Retrieved 11 July 2023.
  38. Panja, Tariq; Draper, Kevin (6 April 2020). "U.S. Says FIFA Officials Were Bribed to Award World Cups to Russia and Qatar". The New York Times.
  39. "Massive scandal in FIFA World Cup 2022: Qatar accused of bribing Ecuador players 7.4 million dollars to lose opener". 19 November 2022.
  40. "The World's Richest and Poorest Countries". Global Finance Magazine. Archived from the original on 17 May 2014. Retrieved 3 March 2015.
  41. "What We Do". Archived from the original on 31 January 2008. Retrieved 3 March 2015.
  42. "Qatar Country Commercial Guide: Market Challenges. International Trade Administration" . Retrieved 21 January 2022.
  43. "Qatar: Economy".
  44. "Edit/Review Countries". Archived from the original on 11 June 2010. Retrieved 11 June 2015.
  45. Nuqudy.com: "Qatar to register 9.8% economic growth in 2012"قطر تسجل 9.8% نموا اقتصاديا في 2012 Archived 24 September 2018 at the Wayback Machine
  46. "Report for Selected Countries and Subjects". www.imf.org. Retrieved 11 September 2018.
  47. "IMF Executive Board Concludes 2019 Article IV Consultation with Qatar". www.imf.org. Retrieved 17 October 2021.

https://www.worlddata.info/asia/qatar/index.php#:~:text=With%20a%20Human%20Development%20Index,richest%20countries%20in%20the%20world.