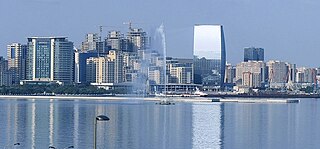
The economy of Azerbaijan is highly dependent on oil and gas exports, in particular since the completion of the Baku-Tbilisi-Ceyhan Pipeline. The transition to oil production in the late 1990s led to rapid economic growth over the period 1995–2014. Since 2014, GDP growth has slowed down substantially.
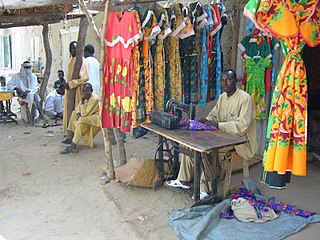
The economy of Chad suffers from the landlocked country's geographic remoteness, drought, lack of infrastructure, and political turmoil. About 85% of the population depends on agriculture, including the herding of livestock. Of Africa's Francophone countries, Chad benefited least from the 50% devaluation of their currencies in January 1994. Financial aid from the World Bank, the African Development Bank, and other sources is directed largely at the improvement of agriculture, especially livestock production. Because of lack of financing, the development of oil fields near Doba, originally due to finish in 2000, was delayed until 2003. It was finally developed and is now operated by ExxonMobil. In terms of gross domestic product, Chad ranks 147th globally with $11.051 billion as of 2018.

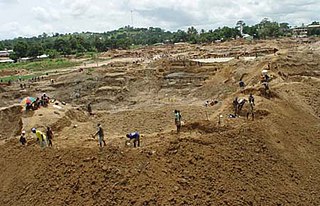
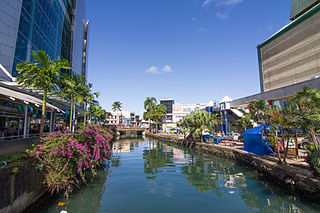
The economy of the Dominican Republic is the seventh largest in Latin America, and is the largest in the Caribbean and Central American region. The Dominican Republic is an upper-middle income developing country with important sectors including mining, tourism, manufacturing, energy, real estate, infrastructure, telecommunications and agriculture. The Dominican Republic is on track to achieve its goal of becoming a high-income country by 2030, and is expected to grow 79% in this decade. The country is the site of the single largest gold mine in Latin America, the Pueblo Viejo mine.Although the service sector is currently the leading employer of Dominicans, agriculture remains an important sector in terms of the domestic market and is in second place in terms of export earnings. Tourism accounts for more than $7.4 billion in annual earnings in 2019. Free-trade zone earnings and tourism are the fastest-growing export sectors. A leading growth engine in the Free-trade zone sector is the production of medical equipment for export having a value-added per employee of $20,000 USD, total revenue of $1.5 billion USD, and a growth rate of 7.7% in 2019. The medical instrument export sector represents one of the highest-value added sectors of the country's economy, a true growth engine for the country's emerging market. Remittances are an important sector of the economy, contributing $8.2 billion in 2020. Most of these funds are used to cover household expenses, such as housing, food, clothing, health care and education. Secondarily, remittances have financed businesses and productive activities. Thirdly, this combined effect has induced investment by the private sector and helps fund the public sector through its value-added tax. The combined import market including the free-trade-zones amounts to a market of $20 billion a year in 2019. The combined export sector had revenues totaling $11 billion in 2019. The consumer market is equivalent to $61 billion in 2019. An important indicator is the average commercial loan interest rate, which directs short-term investment and stimulates long-term investment in the economy. It is currently 8.30%, as of June 2021.

The economy of Gabon is characterized by strong links with France, large foreign investments, dependence on skilled foreign labor, and decline of agriculture. Gabon on paper enjoys a per capita income four times that of most nations of Africa, but its reliance on resource extraction industry fail to release much of the population from extreme poverty, as much of 30% of the population lives under the poverty threshold.

The economy of Kyrgyzstan is heavily dependent on the agricultural sector. Cotton, tobacco, wool, and meat are the main agricultural products, although only tobacco and cotton are exported in any quantity. According to Healy Consultants, Kyrgyzstan's economy relies heavily on the strength of industrial exports, with plentiful reserves of gold, mercury and uranium. The economy also relies heavily on remittances from foreign workers. Following independence, Kyrgyzstan was progressive in carrying out market reforms, such as an improved regulatory system and land reform. In 1998, Kyrgyzstan was the first Commonwealth of Independent States (CIS) country to be accepted into the World Trade Organization. Much of the government's stock in enterprises has been sold. Kyrgyzstan's economic performance has been hindered by widespread corruption, low foreign investment and general regional instability. Despite those issues, Kyrgyzstan is ranked 70th on the ease of doing business index.

The economy of Libya depends primarily on revenues from the petroleum sector, which represents over 95% of export earnings and 60% of GDP. These oil revenues and a small population have given Libya one of the highest nominal per capita GDP in Africa.

The economy of Malawi is $7.522 billion by gross domestic product as of 2019, and is predominantly agricultural, with about 80% of the population living in rural areas. The landlocked country in south central Africa ranks among the world's least developed countries. In 2017, agriculture accounted for about one-third of GDP and about 80% of export revenue. The economy depends on substantial inflows of economic assistance from the IMF, the World Bank, and individual donor nations. The government faces strong challenges: to spur exports, to improve educational and health facilities, to face up to environmental problems of deforestation and erosion, and to deal with the problem of HIV/AIDS in Africa. Malawi is a least developed country according to United Nations.

The economy of Mali is based to a large extent upon agriculture, with a mostly rural population engaged in subsistence agriculture.

The economy of Nicaragua is focused primarily on the agricultural sector. Nicaragua itself is the least developed country in Central America, and the second poorest in the Americas by nominal GDP. In recent years, under the administrations of Daniel Ortega, the Nicaraguan economy has expanded somewhat, following the Great Recession, when the country's economy actually contracted by 1.5%, due to decreased export demand in the American and Central American markets, lower commodity prices for key agricultural exports, and low remittance growth. The economy saw 4.5% growth in 2010 thanks to a recovery in export demand and growth in its tourism industry. Nicaragua's economy continues to post growth, with preliminary indicators showing the Nicaraguan economy growing an additional 5% in 2011. Consumer Price inflation have also curtailed since 2008, when Nicaragua's inflation rate hovered at 19.82%. In 2009 and 2010, the country posted lower inflation rates, 3.68% and 5.45%, respectively. Remittances are a major source of income, equivalent to 15% of the country's GDP, which originate primarily from Costa Rica, the United States, and European Union member states. Approximately one million Nicaraguans contribute to the remittance sector of the economy.

The gross domestic product (GDP) of Niger was $16.617 billion US dollars in 2023, according to official data from the World Bank. This data is based largely on internal markets, subsistence agriculture, and the export of raw commodities: foodstuffs to neighbors and raw minerals to world markets. Niger, a landlocked West African nation that straddles the Sahel, has consistently been ranked on the bottom of the Human Development Index, at 0.394 as of 2019. It has a very low per capita income, and ranks among the least developed and most heavily indebted countries in the world, despite having large raw commodities and a relatively stable government and society not currently affected by civil war or terrorism. Economic activity centers on subsistence agriculture, animal husbandry, re-export trade, and export of uranium.

The economy of Paraguay is a market economy that is highly dependent on agriculture products. In recent years, Paraguay's economy has grown as a result of increased agricultural exports, especially soybeans. Paraguay has the economic advantages of a young population and vast hydroelectric power. Its disadvantages include the few available mineral resources, and political instability. The government welcomes foreign investment.

Once a single-crop agricultural economy, Saint Lucia has shifted to a tourism and banking serviced-based economy. Tourism, the island's biggest industry and main source of jobs, income and foreign exchange, accounts for 65% of its GDP. Agriculture, which was once the biggest industry, now contributes to less than 3% of GDP, but still accounts for 20% of jobs. The banana industry is now on a decline due to strong competition from low-cost Latin American producers and reduced European trade preferences, but the government has helped revitalize the industry, with 13,734 tonnes exported in 2018. Agricultural crops grown for export are bananas, mangoes, and avocados. The island is considered to have the most diverse and well-developed manufacturing industry in the eastern Caribbean.
The economy of Samoa is dependent on agricultural exports, development aid and private financing from overseas. The country is vulnerable to devastating storms, earthquakes, tsunamis. Agriculture employs two-thirds of the labor force, and furnishes 9% of exports, featuring coconut cream, coconut oil and copra. Outside a large automotive wire harness factory, the manufacturing sector mainly processes agricultural products. Tourism is an expanding sector; more than 70,000 tourists visited the islands in 1996 and 120,000 in 2014. The Samoan Government has called for deregulation of the financial sector, encouragement of investment, and continued fiscal discipline. Observers point to the flexibility of the labor market as a basic strength factor for future economic advances.

The economy of Senegal is driven by mining, construction, tourism, fishing and agriculture, which are the main sources of employment in rural areas, despite abundant natural resources in iron, zircon, gas, gold, phosphates, and numerous oil discoveries recently. Senegal's economy gains most of its foreign exchange from fish, phosphates, groundnuts, tourism, and services. As one of the dominant parts of the economy, the agricultural sector of Senegal is highly vulnerable to environmental conditions, such as variations in rainfall and climate change, and changes in world commodity prices.
The economy of Sierra Leone is $4.082 billion by gross domestic product as of 2018. Since the end of the Sierra Leone Civil War in 2002, the economy is gradually recovering with a gross domestic product growth rate between 4 and 7%. In 2008 it in PPP ranked between 147th by World Bank, and 153rd by CIA, largest in the world.

The economy of Yemen has significantly weakened since the breakout of the Yemeni Civil War and the humanitarian crisis, which has caused instability, escalating hostilities, and flooding in the region. At the time of unification, South Yemen and North Yemen had vastly different but equally struggling underdeveloped economic systems. Since unification, the economy has been forced to sustain the consequences of Yemen's support for Iraq during the 1990–91 Persian Gulf War: Saudi Arabia expelled almost 1 million Yemeni workers, and both Saudi Arabia and Kuwait significantly reduced economic aid to Yemen. The 1994 civil war further drained Yemen's economy. As a consequence, Yemen has relied heavily on aid from multilateral agencies to sustain its economy for the past 24 years. In return, it has pledged to implement significant economic reforms. In 1997 the International Monetary Fund (IMF) approved two programs to increase Yemen's credit significantly: the enhanced structural adjustment facility and the extended funding facility (EFF). In the ensuing years, Yemen's government attempted to implement recommended reforms: reducing the civil service payroll, eliminating diesel and other subsidies, lowering defense spending, introducing a general sales tax, and privatizing state-run industries. However, limited progress led the IMF to suspend funding between 1999 and 2001.
The economy of Fiji is one of the most developed among the Pacific islands. Nevertheless, Fiji is a developing country endowed with forest, mineral and fish resources. The country has a large agriculture sector heavily based on subsistence agriculture. Sugar exports and the tourism industry are the main sources of foreign exchange. There are also light manufacturing and mining sectors.

The economy of Mozambique is $14.396 billion by gross domestic product as of 2018, and has developed since the end of the Mozambican Civil War (1977–1992). In 1987, the government embarked on a series of macroeconomic reforms, which were designed to stabilize the economy. These steps, combined with donor assistance and with political stability since the multi-party elections in 1994, have led to dramatic improvements in the country's growth rate. Inflation was brought to single digits during the late 1990s, although it returned to double digits in 2000–02. Fiscal reforms, including the introduction of a value-added tax and reform of the customs service, have improved the government's revenue collection abilities.

The economy of Papua New Guinea (PNG) is largely underdeveloped with the vast majority of the population living below the poverty line. However, according to the Asian Development Bank its GDP is expected to grow 3.4% in 2022 and 4.6% in 2023. It is dominated by the agricultural, forestry, and fishing sector and the minerals and energy extraction sector. The agricultural, forestry, and fishing sector accounts for most of the labour force of PNG while the minerals and energy extraction sector, including gold, copper, oil and natural gas is responsible for most of the export earnings.

The economy of Ivory Coast is stable and currently growing, in the aftermath of political instability in recent decades. The Ivory Coast's economy is largely market-based and depends heavily on the agricultural sector. Almost 70% of the Ivorian people are engaged in some form of agricultural activity. GDP per capitaArchived 4 May 2012 at the Wayback Machine grew 82% in the 1960s, reaching a peak growth of 360% in the 1970s, but this proved unsustainable and it shrank by 28% in the 1980s and a further 22% in the 1990s. This decline, coupled with high population growth, resulted in a steady fall in living standards. The Gross national product per capita, now rising again, was about US$727 in 1996. It was substantially higher two decades before.


