This article needs to be updated.(March 2015) |
Currency | Libyan dinar (LYD, ل.د) |
---|---|
calendar year | |
Trade organisations | OPEC, COMESA, CEN-SAD, AMU |
Country group |
|
Statistics | |
Population | 6,888,388 (2023) [3] |
GDP | |
GDP rank | |
GDP growth |
|
GDP per capita | |
GDP per capita rank | |
GDP by sector |
|
3.4% (2023) [5] | |
Population below poverty line |
|
N/A | |
0.718 high (2022) [8] | |
Labour force | |
Labour force by occupation |
|
Unemployment | 30% (2004 est.) [7] |
Main industries | petroleum, steel, iron, food processing, textiles, cement |
External | |
Exports | $18.38 billion (2017 est.) [7] |
Export goods | crude oil, refined petroleum products, natural gas, chemicals |
Main export partners |
|
Imports | $11.36 billion (2017 est.) [7] |
Import goods | machinery, transport equipment, semi-finished goods, food, consumer products |
Main import partners |
|
FDI stock | |
$2.574 billion (2017 est.) [7] | |
Gross external debt | $3.02 billion (31 December 2017 est.) [7] |
Public finances | |
4.7% of GDP (2017 est.) [7] | |
−25.1% (of GDP) (2017 est.) [7] | |
Revenues | 13.47 billion (2022 est.) |
Expenses | 30.61 billion (2022 est.) |
Economic aid | recipient ODA $9 million (2010), $642 million (2011), $87 million (2012) [12] |
$74.71 billion (31 December 2017 est.) [7] | |
The economy of Libya depends primarily on revenues from the petroleum sector, which represents over 95% of export earnings and 60% of GDP. [13] These oil revenues and a small population have given Libya one of the highest nominal per capita GDP in Africa. [14] [13]
After 2000, Libya recorded favorable growth rates with an estimated 10.6% growth of GDP in 2010. This development was interrupted by the Libyan Civil War, which resulted in contraction of the economy by 62.1% in 2011. After the war, the economy rebounded by 104.5% in 2012. It crashed again following the Second Libyan Civil War. [15] As of 2017, Libya's per capita PPP GDP stands at 60% of its pre-war level. [15]
Libyan GDP per capita was about $40 in the early 1920s and it rose to $1,018 by 1967. In 1947 alone, per capita GDP rose by 42 percent.
The following table shows the main economic indicators in 1980–2021 (with IMF staff estimates in 2022–2027). Inflation below 5% is in green. [16] The annual unemployment rate is extracted from the World Bank, although the International Monetary Fund find them unreliable.
Year | GDP (in Bil. US$PPP) | GDP per capita (in US$ PPP) | GDP (in Bil. US$nominal) | GDP per capita (in US$ nominal) | GDP growth (real) | Inflation rate (in Percent) | Unemployment (in Percent) | Government debt (in % of GDP) |
---|---|---|---|---|---|---|---|---|
1980 | 97.8 | 32,745.5 | 40.2 | 13,449.6 | 0.6% | 14.3% | n/a | n/a |
1981 | 85.6 | 27,398.5 | 34.7 | 11,107.6 | -20.0% | 13.2% | n/a | n/a |
1982 | 92.3 | 28,202.7 | 34.6 | 10,575.6 | 1.5% | 13.8% | n/a | n/a |
1983 | 91.4 | 26,800.2 | 33.0 | 9,671.5 | -4.7% | 10.5% | n/a | n/a |
1984 | 86.8 | 24,406.1 | 30.9 | 8,681.2 | -8.3% | 12.4% | n/a | n/a |
1985 | 90.1 | 25,471.4 | 30.4 | 8,586.4 | 0.6% | 9.1% | n/a | n/a |
1986 | 81.5 | 22,172.1 | 24.8 | 6,734.0 | -11.4% | 3.4% | n/a | n/a |
1987 | 71.2 | 18,585.1 | 23.0 | 6,002.1 | -14.7% | 4.4% | n/a | n/a |
1988 | 79.3 | 18,346.5 | 25.9 | 5,981.6 | 7.6% | 3.1% | n/a | n/a |
1989 | 88.4 | 19,550.0 | 27.4 | 6,070.1 | 7.2% | 4.5% | n/a | n/a |
1990 | 95.1 | 22,327.7 | 31.6 | 7,424.2 | 3.7% | 0.7% | n/a | 4.7% |
1991 | 116.3 | 26,685.3 | 35.0 | 8,026.3 | 18.3% | 11.7% | 19.8% | 9.6% |
1992 | 113.6 | 25,468.7 | 35.5 | 7,950.5 | -4.5% | 9.5% | 20.0% | 1.2% |
1993 | 109.9 | 24,106.1 | 31.9 | 6,998.3 | -5.5% | 7.5% | 20.0% | -4.6% |
1994 | 115.9 | 24,921.7 | 29.7 | 6,391.1 | 3.2% | 10.7% | 19.9% | -1.6% |
1995 | 100.1 | 21,064.9 | 33.7 | 7,102.9 | -15.4% | 8.3% | 20.0% | 4.8% |
1996 | 103.7 | 21,422.2 | 36.8 | 7,608.8 | 1.8% | 4.0% | 19.8% | 12.2% |
1997 | 102.7 | 20,872.4 | 37.7 | 7,663.0 | -2.6% | 3.6% | 19.8% | -1.3% |
1998 | 103.1 | 20,587.9 | 30.9 | 6,171.8 | -0.7% | 3.7% | 19.8% | -1.5% |
1999 | 104.4 | 20,511.0 | 37.1 | 7,294.5 | -0.2% | 2.6% | 19.7% | 6.4% |
2000 | 111.1 | 21,444.4 | 39.5 | 7,625.0 | 4.0% | -2.9% | 19.7% | 13.6% |
2001 | 116.6 | 22,161.2 | 35.2 | 6,693.1 | 2.6% | -8.8% | 19.7% | 0.4% |
2002 | 114.0 | 21,343.2 | 21.1 | 3,956.5 | -3.7% | -9.9% | 19.6% | 7.0% |
2003 | 135.0 | 24,905.2 | 27.0 | 4,986.3 | 16.1% | -2.1% | 19.5% | 6.2% |
2004 | 146.7 | 26,626.3 | 34.1 | 6,180.4 | 5.8% | 1.3% | 19.5% | 11.3% |
2005 | 167.4 | 29,942.7 | 48.9 | 8,739.2 | 10.6% | 2.7% | 19.4% | 30.4% |
2006 | 173.0 | 30,408.6 | 60.1 | 10,561.4 | 0.3% | 1.5% | 19.4% | 29.1% |
2007 | 188.8 | 32,659.5 | 68.2 | 11,801.3 | 6.2% | 6.2% | 19.4% | 28.4% |
2008 | 192.1 | 32,666.6 | 86.8 | 14,762.6 | -0.2% | 10.4% | 19.4% | 27.7% |
2009 | 184.8 | 31,007.5 | 60.8 | 10,202.8 | -4.4% | 2.4% | 19.4% | -5.5% |
2010 | 196.4 | 32,515.4 | 75.4 | 12,478.0 | 5.0% | 2.5% | 19.3% | 11.5% |
2011 | 99.6 | 16,810.9 | 48.2 | 8,132.3 | -50.3% | 15.9% | 19.4% | -11.5% |
2012 | 172.5 | 27,458.8 | 92.5 | 14,728.1 | 86.8% | 6.1% | 19.0% | 24.6% |
2013 | 144.5 | 23,054.5 | 75.4 | 12,025.6 | -18.0% | 2.6% | 19.5% | -16.3% |
2014 | 126.9 | 20,273.6 | 57.4 | 9,166.6 | -23.0% | 2.4% | 19.5% | -30.5% |
2015 | 137.2 | 21,709.9 | 48.7 | 7,706.7 | -0.8% | 10.0% | 19.5% | -28.5% |
2016 | 137.4 | 21,520.7 | 49.9 | 7,817.6 | -1.5% | 25.9% | 19.5% | -29.3% |
2017 | 154.4 | 23,949.3 | 67.2 | 10,414.1 | 32.5% | 25.9% | 19.4% | -11.1% |
2018 | 170.7 | 26,207.0 | 76.7 | 11,773.8 | 7.9% | 14.0% | 19.5% | 9.4% |
2019 | 154.3 | 23,454.9 | 69.2 | 10,526.3 | -11.2% | -2.9% | 19.7% | 11.9% |
2020 | 110.1 | 16,575.1 | 46.9 | 7,056.7 | -29.5% | 1.5% | 20.1% | -22.3% |
2021 | 147.1 | 21,929.0 | 39.0 | 5,813.3 | 28.3% | 2.8% | 19.6% | 11.3% |
2022 | 128.4 | 18,944.7 | 40.8 | 6,025.7 | -18.5% | 5.5% | n/a | 15.8% |
2023 | 156.7 | 22,899.5 | 43.8 | 6,391.8 | 17.9% | 4.0% | n/a | 22.1% |
2024 | 172.8 | 24,997.2 | 45.6 | 6,599.0 | 8.0% | 3.0% | n/a | 18.8% |
2025 | 188.8 | 27,034.7 | 47.7 | 6,836.3 | 7.2% | 3.0% | n/a | 16.5% |
2026 | 200.5 | 28,434.6 | 49.1 | 6,964.6 | 4.2% | 3.0% | n/a | 13.5% |
2027 | 212.8 | 29,874.1 | 50.5 | 7,096.0 | 4.1% | 3.1% | n/a | 9.7% |
Notes:
1. For purchasing power parity comparisons, the US Dollar is exchanged at 0.77 Libyan Dinars only.
Mean wages were $9.51 per man-hour in 2009 (amounts to a compensation of $1598 for 21 working days of 8 hours).
Libya is an OPEC member and holds the largest proven oil reserves in Africa (followed by Nigeria and Algeria), 41.5 Gbbl (6.60×10⁹ m3) as of January 2007, up from 39.1 Gbbl (6.22×10⁹ m3) in 2006. About 80% of Libya's proven oil reserves are located in the Sirte Basin, which is responsible for 90% of the country's oil output. [17] The state-owned National Oil Corporation (NOC) dominates Libya's oil industry, along with smaller subsidiaries, which combined account for around 50% of the country's oil output. Among NOC's subsidiaries, the largest oil producer is the Waha Oil Company (WOC), followed by the Agoco, Zueitina Oil Company (ZOC), and Sirte Oil Company (SOC). Oil resources, which account for approximately 95% of export earnings, 75% of government receipts, and over 50% of GDP. Oil revenues constitute the principal foreign exchange source. Reflecting the heritage of the command economy, three-quarters of employment is in the public sector, and private investment remains small at around 2% of GDP. [18]
Falling world oil prices in the early 1980s and economic sanctions caused a serious decline in economic activity, eventually leading to a slow private sector rehabilitation. At 2.6% per year on average, real GDP growth was modest and volatile during the 1990s. Libya's GDP grew in 2001 due to high oil prices, the end of a long cyclical drought, and increased foreign direct investment following the suspension of UN sanctions in 1999. Real GDP growth has been boosted by high oil revenues, reaching 4.6% in 2004 and 3.5% in 2005. Despite efforts to diversify the economy and encourage private sector participation, extensive controls of prices, credit, trade, and foreign exchange constrain growth.
Although UN sanctions were suspended in 1999, foreign investment in the Libyan gas and oil sectors were severely curtailed due to the U.S. Iran and Libya Sanctions Act (ILSA), which capped the amount foreign companies can invest in Libya yearly at $20 million (lowered from $40 million in 2001). As of May 2006, the U.S. has removed Libya from its list of states that sponsor terrorism and has normalised ties and removed sanctions. This clears the road for U.S. oil companies to exploit Libyan oil and is expected to have a positive impact on the Libyan economy.
The NOC hopes to raise oil production from 1.80 million bpd in 2006 to 2 million bpd by 2008. FDI into the oil sector is likely, which is attractive due to its low cost of oil recovery, high oil quality, and proximity to European markets. [19] Most Libyan oil is sold on a term basis, including to the country's Oilinvest marketing network in Europe; to companies like Agip, OMV, Repsol YPF, Tupras, CEPSA, and Total; and small volumes to Asian and South African companies. [20]
Statistic | Amount |
---|---|
Proven Oil Reserves (2007E) | 41.5 Gbbl (6.60×10 9 m3) |
Oil Production (2006E) | 1.8 million barrels per day (290×10 3 m3/d) (95% crude) |
Oil Consumption (2006E) | 284,000 barrels per day (45,200 m3/d) |
Net Oil Exports (2006E) | 1.5 million barrels per day (240×10 3 m3/d) |
Crude Oil Distillation Capacity (2006E) | 378 kbbl/d (60.1×10 3 m3/d) |
Proven Natural Gas Reserves (2007E) | 52.7×10 12 cu ft (1.49×10¹² m3) |
Natural Gas Production (2006E) | 3,999×10 9 cu ft (1.132×10¹¹ m3) |
Natural Gas consumption (2005E) | 206×10 9 cu ft (5.8×10⁹ m3) |
Notes:
1. Energy Information Administration (2007)
In November 2005, Repsol YPF discovered a significant oil deposit of light, sweet crude in the Murzuq Basin. Industry experts believe the discovery to be one of the biggest made in Libya for several years. Repsol YPF is joined by a consortium of partners including OMV, Total and Norsk Hydro. Also located in Murzuq Basin is Eni's Elephant field. In October 1997, a consortium led by British company Lasmo, along with Eni and a group of five South Korean companies, announced that it had discovered large recoverable crude reserves about 800 kilometres (500 mi) south of Tripoli. [21] Lasmo estimated field production would cost around $1 per barrel. Elephant began production in February 2004.
WOC's Waha fields currently produce around 350,000 bbl/d (56,000 m3/d). In 2005, ConocoPhillips and co-venturers reached an agreement with NOC to return to its operations in Libya and extend the Waha concession 25 years. ConocoPhillips operates the Waha fields with a 16.33% share in the project. NOC has the largest share of the Waha concession, and additional partners include Marathon and Amerada Hess. [22]
Libya has five domestic refineries:
Refinery | Capacity | Operator |
---|---|---|
Zawia Refinery | 120,000 | ZOC |
Ras Lanuf Refinery | 220,000 | Ras Lanuf |
El-Brega Refinery | 10,000 | SOC |
Tobruk Refinery | 20,000 | Agoco |
Sarir Refinery | 10,000 | Agoco |
Notes:
1. Amounts in barrels per day.
In 2007, mining and hydrocarbon industries accounted for well over 95 percent of the Libyan economy.[ citation needed ] Diversification of the economy into manufacturing industries remain a long-term issue.
Although agriculture is the second-largest sector in the economy, Libya depends on imports in most foods. Climatic conditions and poor soils severely limit farm output, and domestic food production meets only about 25% of demand. Domestic conditions limit output, while higher incomes and a growing population have caused food consumption to rise. Because of low rainfall levels in Libya, agricultural projects such as the Kufra oasis rely on underground water sources. Libya's primary agricultural water source remains the Great Manmade River (GMMR), but significant resources are being invested in desalinization research to meet growing demand. Libyan agricultural projects and policies are overseen by a General Inspector; there is no Ministry of Agriculture, per se. [23]
Libya produced in 2018:
In addition to smaller productions of other agricultural products. [24]
The tourism industry was heavily hit by the Libyan Civil War. Before the war tourism was developing, with 149,000 tourists visiting Libya in 2004, rising to 180,000 in 2007, although this still only contributed less than 1% of the country's GDP. There were 1,000,000 day visitors in the same year. [25] [26] The country is best known for its ancient Greek and Roman ruins and Sahara desert landscapes.
Libya posted a 3.3% rate of population growth during 1960–2003. In 2003, 86% of the population was urban, compared to 45% in 1970. Although no reliable estimates are available, unemployment is reportedly acute: over 50% of the population under the age of 20. Moreover, despite the bias of labor market regulations favoring Libyan workers, the mismatch of the educational system with market demand has produced a large pool of expatriate workers, with typically better-suited education and higher productivity. However, because of shortages for manual labor, Libya has also attracted important numbers of less skilled immigrants. Expatriate workers represent an estimated fifth of the labor force. [27]
Although significant, the proportion of expatriate workers is still below oil producing countries in the Persian Gulf. Foreign workers mainly come from the Maghreb, Egypt, Turkey, India, the Philippines, Malaysia, Thailand, Vietnam, Poland, Chad, Sudan, and Bosnia and Herzegovina. [28] [29] They tend to earn relatively high wages, taking either skilled or hard manual jobs. Census data for 2000 show the share of expatriates earning over LD 300 (US$230) per month was 20%, compared to 12% for Libyan nationals. A campaign encouraging conversion of qualified civil servants to entrepreneurs, in the face of public sector over employment and declining productivity, does not seem to be producing the desired results thus far. [18]
The Government is in the process of preparing a financial sector reform program. Recent legislation setting corporate governance standards for financial institutions makes progress towards better management and greater operational independence of public banks. However, Libyan public banks still lack management structures supported by skills in critical areas like credit, investment, risk management, and information and control systems.
The new banking law reinforces the independence of the Central Bank of Libya (CBL) and offers a legal framework for regulating banking activities, even if some provisions call for improvement. Despite progress brought by the new banking Law that specifies and limits its duties and responsibilities, the CBL remains the owner of the public banks, with the associated potential conflict of interest between ownership and regulation.
Financial sector reform has also progressed with partial interest rate liberalization. Interest rates have been liberalized on deposits, while a lending rate ceiling has been set above the discount rate. The Libyan Stock Exchange, established in 2007, is the first exchange of its kind in the country.
In 2011, Libya Oil Holdings had its €38m stake in Irish exploration firm Circle Oil frozen on foot of a European Union order that's been put in place to put pressure on the Gaddafi regime. [30]
Two trans-African automobile routes pass through Libya:
Household income or consumption by percentage share:
lowest 11%: NA%
highest 10%: NA%
Industrial production growth rate: 2.7% (2009)
Electricity - production: 24 billion kWh (2007 est)
Electricity - production by source:
fossil fuel: 100%
hydro: 0%
nuclear: 0%
other: 0% (1998)
Electricity - consumption: 22.17 billion kWh (2007 est)
Electricity - exports: 104 million kWh (2007)
Electricity - imports: 77 million kWh (2007)
Agriculture - products: wheat, barley, olives, dates, citrus, vegetables, peanuts, soybeans, cattle, corn
Organisation | Survey | Ranking |
---|---|---|
The Economist | The World in 2005 - Worldwide quality-of-life index, 2005 | 70 out of 111 |
Energy Information Administration | Greatest Oil Reserves by Country, 2006 | 9 out of 20 |
Reporters Without Borders | Press Freedom Index (2007) | 155 out of 169 |
Transparency International | Corruption Perceptions Index 2007 | 131 out of 180 |
United Nations Development Programme | Human Development Index 2005 | 58 out of 177 |
{{cite web}}
: Check |url=
value (help)
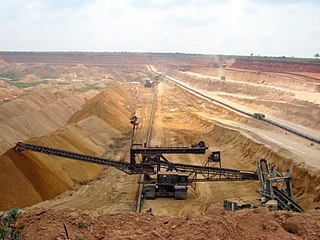
The economy of Angola remains heavily influenced by the effects of four decades of conflict in the last part of the 20th century, the war for independence from Portugal (1961–75) and the subsequent civil war (1975–2002). Poverty since 2002 is reduced over 50% and a third of the population relies on subsistence agriculture. Since 2002, when the 27-year civil war ended, government policy prioritized the repair and improvement of infrastructure and strengthening of political and social institutions. During the first decade of the 21st century, Angola's economy was one of the fastest-growing in the world, with reported annual average GDP growth of 11.1 percent from 2001 to 2010. High international oil prices and rising oil production contributed to strong economic growth, although with high inequality, at that time. 2022 Trade surplus was &30B/2012 $48B
The economy of Benin remains underdeveloped and dependent on subsistence agriculture and cotton. Cotton accounts for 40% of Benin's GDP and roughly 80% of official export receipts. There is also production of textiles, palm products, and cocoa beans. Maize (corn), beans, rice, peanuts, cashews, pineapples, cassava, yams, and other various tubers are grown for local subsistence. Benin began producing a modest quantity of offshore oil in October 1982. Production ceased in recent years but exploration of new sites is ongoing.
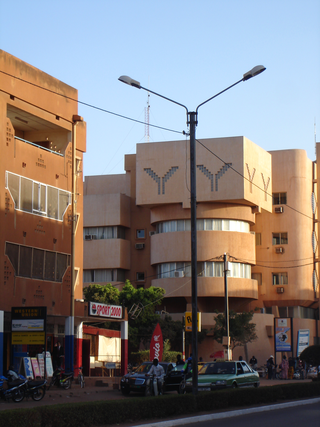
The economy of Burkina Faso is based primarily on subsistence farming and livestock raising. Burkina Faso has an average income purchasing-power-parity per capita of $1,900 and nominal per capita of $790 in 2014. More than 80% of the population relies on subsistence agriculture, with only a small fraction directly involved in industry and services. Highly variable rainfall, poor soils, lack of adequate communications and other infrastructure, a low literacy rate, and a stagnant economy are all longstanding problems of this landlocked country. The export economy also remained subject to fluctuations in world prices.
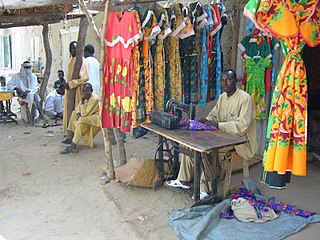
The economy of Chad suffers from the landlocked country's geographic remoteness, drought, lack of infrastructure, and political turmoil. About 85% of the population depends on agriculture, including livestock herding. Of Africa's Francophone countries, Chad benefited least from the 50% devaluation of their currencies in January 1994. Financial aid from the World Bank, the African Development Bank, and other sources is directed mainly at improving agriculture, especially livestock production. Because of a lack of financing, the development of oil fields near Doba, originally due to finish in 2000, was delayed until 2003. It was finally developed and is now operated by ExxonMobil. Regarding gross domestic product, Chad ranks 147th globally with $11.051 billion as of 2018.
The economy of Ecuador is the eighth largest in Latin America and the 69th largest in the world by total GDP. Ecuador's economy is based on the export of oil, bananas, shrimp, gold, other primary agricultural products and money transfers from Ecuadorian emigrants employed abroad. In 2017, remittances constituted 2.7% of Ecuador's GDP. The total trade amounted to 42% of the Ecuador's GDP in 2017.
The economy of Ethiopia is a mixed and transition economy with a large public sector. The government of Ethiopia is in the process of privatizing many of the state-owned businesses and moving toward a market economy. The banking, telecommunication and transportation sectors of the economy are dominated by government-owned companies.
The economy of Kenya is market-based with a few state enterprises. Kenya has an emerging market and is an averagely industrialised nation ahead of its East African peers. Currently a lower middle income nation, Kenya plans to be a newly industrialised nation by 2030. Major industries within the Kenyan market include financial services, agriculture, real estate, manufacturing, logistics, tourism, retail and energy. As of 2020, Kenya had the third largest economy in Sub-Saharan Africa, behind Nigeria and South Africa. Regionally, Kenya has had a stronger and more stable economy compared to its neighboring countries within East Africa.By 2023, the country had become Africa's largest start-up hub by both funds invested and number of projects.
The economy of Kyrgyzstan is heavily dependent on the agricultural sector. Cotton, tobacco, wool, and meat are the main agricultural products, although only tobacco and cotton are exported in any quantity. According to Healy Consultants, Kyrgyzstan's economy relies heavily on the strength of industrial exports, with plentiful reserves of gold, mercury and uranium. The economy also relies heavily on remittances from foreign workers. Following independence, Kyrgyzstan was progressive in carrying out market reforms, such as an improved regulatory system and land reform. In 1998, Kyrgyzstan was the first Commonwealth of Independent States (CIS) country to be accepted into the World Trade Organization. Much of the government's stock in enterprises has been sold. Kyrgyzstan's economic performance has been hindered by widespread corruption, low foreign investment and general regional instability. Despite those issues, Kyrgyzstan is ranked 70th on the ease of doing business index.
The economy of Laos is a lower-middle income developing economy. Being one of the socialist states, the Lao economic model resembles the Chinese socialist market and/or Vietnamese socialist-oriented market economies by combining high degrees of state ownership with openness to foreign direct investment and private ownership in a predominantly market-based framework.
The economy of Nicaragua is focused primarily on the agricultural sector. Nicaragua itself is the least developed country in Central America, and the second poorest in the Americas by nominal GDP. In recent years, under the administrations of Daniel Ortega, the Nicaraguan economy has expanded somewhat, following the Great Recession, when the country's economy actually contracted by 1.5%, due to decreased export demand in the American and Central American markets, lower commodity prices for key agricultural exports, and low remittance growth. The economy saw 4.5% growth in 2010 thanks to a recovery in export demand and growth in its tourism industry. Nicaragua's economy continues to post growth, with preliminary indicators showing the Nicaraguan economy growing an additional 5% in 2011. Consumer Price inflation have also curtailed since 2008, when Nicaragua's inflation rate hovered at 19.82%. In 2009 and 2010, the country posted lower inflation rates, 3.68% and 5.45%, respectively. Remittances are a major source of income, equivalent to 15% of the country's GDP, which originate primarily from Costa Rica, the United States, and European Union member states. Approximately one million Nicaraguans contribute to the remittance sector of the economy.
The economy of Paraguay is a market economy that is highly dependent on agriculture products. In recent years, Paraguay's economy has grown as a result of increased agricultural exports, especially soybeans. Paraguay has the economic advantages of a young population and vast hydroelectric power. Its disadvantages include the few available mineral resources, and political instability. The government welcomes foreign investment.
The economy of Sudan is largely based on agriculture and oil exports, with additional revenue coming from mining and manufacturing. GDP growth registered more than 10% per year in 2006 and 2007. Sudan had $30.873 billion by gross domestic product as of 2019, and has been working with the International Monetary Fund (IMF) to implement macroeconomic reforms, including a managed float of the exchange rate. Sudan began exporting crude oil in the last quarter of 1999.
The economy of Tajikistan is dependent upon agriculture and services. Since independence, Tajikistan has gradually followed the path of transition economy, reforming its economic policies. With foreign revenue precariously dependent upon exports of cotton and aluminium, the economy is highly vulnerable to external shocks. Tajikistan's economy also incorporates a massive black market, primarily focused on the drug trade with Afghanistan. Heroin trafficking in Tajikistan is estimated to be equivalent to 30-50% of national GDP as of 2012.
The economy of Togo has struggled greatly. The International Monetary Fund (IMF) ranks it as the tenth poorest country in the world, with development undercut by political instability, lowered commodity prices, and external debts. While industry and services play a role, the economy is dependent on subsistence agriculture, with industrialization and regional banking suffering major setbacks.
The economy of Yemen has significantly weakened since the breakout of the Yemeni Civil War and the humanitarian crisis, which has caused instability, escalating hostilities, and flooding in the region. At the time of unification, South Yemen and North Yemen had vastly different but equally struggling underdeveloped economic systems. Since unification, the economy has been forced to sustain the consequences of Yemen's support for Iraq during the 1990–91 Persian Gulf War: Saudi Arabia expelled almost 1 million Yemeni workers, and both Saudi Arabia and Kuwait significantly reduced economic aid to Yemen. The 1994 civil war further drained Yemen's economy. As a consequence, Yemen has relied heavily on aid from multilateral agencies to sustain its economy for the past 24 years. In return, it has pledged to implement significant economic reforms. In 1997 the International Monetary Fund (IMF) approved two programs to increase Yemen's credit significantly: the enhanced structural adjustment facility and the extended funding facility (EFF). In the ensuing years, Yemen's government attempted to implement recommended reforms: reducing the civil service payroll, eliminating diesel and other subsidies, lowering defense spending, introducing a general sales tax, and privatizing state-run industries. However, limited progress led the IMF to suspend funding between 1999 and 2001.
The economy of Tunisia is in the process of being liberalized after decades of heavy state direction and participation in the country's economy. Prudent economic and fiscal planning has resulted in moderate but sustained growth for over a decade. Tunisia's economic growth historically has depended on oil, phosphates, agri-food products, car parts manufacturing, and tourism. In the World Economic Forum Global Competitiveness Report for 2015–2016, Tunisia ranks in 92nd place.
The economy of Madagascar is US$9.769 billion by gross domestic product as of 2020, being a market economy and is supported by an agricultural industry and emerging tourism, textile and mining industries. Malagasy agriculture produces tropical staple crops such as rice and cassava, as well as cash crops such as vanilla and coffee.
The economy of Papua New Guinea (PNG) is largely underdeveloped with the vast majority of the population living below the poverty line. However, according to the Asian Development Bank its GDP is expected to grow 3.4% in 2022 and 4.6% in 2023. It is dominated by the agricultural, forestry, and fishing sector and the minerals and energy extraction sector. The agricultural, forestry, and fishing sector accounts for most of the labour force of PNG while the minerals and energy extraction sector, including gold, copper, oil and natural gas is responsible for most of the export earnings.
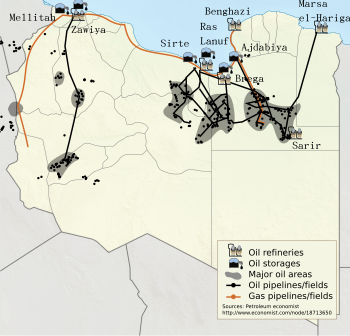
The National Oil Corporation is the national oil company of Libya. It dominates Libya's oil industry, along with a number of smaller subsidiaries, which combined account for around 70% the country's oil output. Of NOC's subsidiaries, the largest oil producer is the Waha Oil Company (WOC), followed by the Arabian Gulf Oil Company (Agoco), Zueitina Oil Company (ZOC), and Sirte Oil Company (SOC).
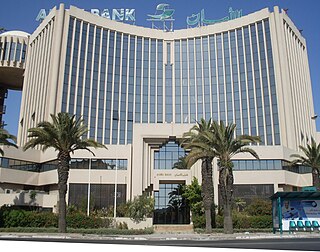
The economy of Algeria deals with Algeria's current and structural economic situation. Since independence in 1962, Algeria has launched major economic projects to build up a dense industrial base. However, despite these major achievements, the Algerian economy has gone through various stages of turbulence.