Characteristics
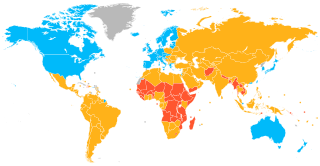
The greatest cases of inequity typically would involve an impoverished and politically unstable country neighbouring a resource-rich and relatively stable one, although neither may be recognised as a high-income economy. As an extreme example, the GDP per capita for Saudi Arabia, is over 42 times greater to that of its neighbour Yemen. In the four biggest ratios, the poorer country is either Yemen or North Korea.
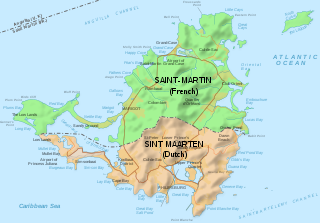
Due to lack of economic data, the Vatican City (which is surrounded by Italy), Saint Martin (which shares the island of Saint Martin with Sint Maarten) and the British Overseas Territories of Akrotiri and Dhekelia located in the island of Cyprus, are not included in this list.
| Rank | Richer country | GDP (PPP) per capita (Intl. $) [1] | Year | Poorer country | GDP (PPP) per capita (Intl. $) [1] | Year | Ratio [2] | Continent/ Region |
|---|---|---|---|---|---|---|---|---|
| 1 | 54,800 | 2017 est. | 1,300 | 2017 est. | 42.154 | Asia | ||
| 2 | 45,200 | 2017 est. | 1,300 | 2017 est. | 34.769 | Asia | ||
| 3 | 39,400 | 2017 est. | 1,700 | 2015 est. | 23.176 | Asia | ||
| 4 | 27,800 | 2017 est. | 1,700 | 2015 est. | 16.353 | Europe / Asia | ||
| 5 | 15,200 | 2017 est. | 1,200 | 2017 est. | 12.667 | Africa | ||
| 6 | 36,300 | 2017 est. | 2,900 | 2015 est. | 12.517 | Asia | ||
| 7 | 13,500 | 2017 est. | 1,200 | 2017 est. | 11.250 | Africa | ||
| 8 | 20,200 | 2017 est. | 2,000 | 2017 est. | 10.100 | Asia | ||
| 9 | 16,700 | 2017 est. | 1,700 | 2015 est. | 9.824 | Asia | ||
| 10 | 36,000 | 2017 est. | 3,700 | 2017 est. | 9.730 | Africa | ||
| 11 | 6,600 | 2017 est. | 700 | 2017 est. | 9.429 | Africa | ||
| 12 | 16,900 | 2017 est. | 1,800 | 2017 est. | 9.389 | Americas | ||
| 13 | 26,900 | 2017 est. | 2,900 | 2015 est. | 9.276 | Asia | ||
| 14 | 18,100 | 2017 est. | 2,000 | 2017 est. | 9.050 | Asia | ||
| 15 | 6,800 | 2017 est. | 800 | 2017 est. | 8.500 | Africa | ||
| 16 | 36,300 | 2017 est. | 4,300 | 2014 est. | 8.442 | Asia | ||
| 17 | 16,700 | 2017 est. | 2,000 | 2017 est. | 8.350 | Asia | ||
| 18 | 10,000 | 2017 est. | 1,200 | 2017 est. | 8.333 | Africa | ||
| 19 | 6,600 | 2017 est. | 800 | 2017 est. | 8.250 | Africa | ||
| 20 | 9,900 | 2017 est. | 1,200 | 2017 est. | 8.250 | Africa | ||
| 21 | 17,800 | 2017 est. | 2,300 | 2017 est. | 7.739 | Africa | ||
| 22 | 26,300 | 2017 est. | 3,700 | 2017 est. | 7.108 | Asia | ||
| 23 | 15,200 | 2017 est. | 2,200 | 2017 est. | 6.909 | Africa | ||
| 24 | 19,400 | 2017 est. | 2,900 | 2015 est. | 6.690 | Asia | ||
| 25 | 111,600 | 2017 est. | 16,700 | 2017 est. | 6.683 | Asia | ||
| 26 | 4,600 | 2017 est. | 700 | 2017 est. | 6.571 | Africa | ||
| 27 | 16,700 | 2017 est. | 2,700 | 2017 est. | 6.185 | Asia | ||
| 28 | 15,200 | 2017 est. | 2,500 | 2007 est. | 6.080 | Africa | ||
| 29 | 13,500 | 2017 est. | 2,300 | 2017 est. | 5.870 | Africa | ||
| 30 | 17,000 | 2017 est. | 2,900 | 2015 est. | 5.862 | Asia | ||
| 31 | 3,700 | 2017 est. | 700 | 2017 est. | 5.286 | Africa | ||
| 32 | 16,700 | 2017 est. | 3,200 | 2017 est. | 5.219 | Asia | ||
| 33 | 19,200 | 2017 est. | 3,700 | 2017 est. | 5.189 | Africa | ||
| 34 | 4,000 | 2017 est. | 800 | 2017 est. | 5.000 | Africa | ||
| 35 | 5,900 | 2017 est. | 1,200 | 2017 est. | 4.917 | Africa | ||
| 36 | 3,200 | 2017 est. | 700 | 2017 est. | 4.571 | Africa | ||
| 37 | 16,700 | 2017 est. | 3,700 | 2017 est. | 4.514 | Asia | ||
| 38 | 17,900 | 2017 est. | 4,000 | 2017 est. | 4.475 | Asia | ||
| 39 | 38,300 | 2017 est. | 8,600 | 2017 est. | 4.453 | Europe / Africa | ||
| 40 | 17,800 | 2017 est. | 4,000 | 2017 est. | 4.450 | Africa | ||
| 41 | 54,800 | 2017 est. | 12,500 | 2017 est. | 4.384 | Asia | ||
| 42 | 10,000 | 2017 est. | 2,300 | 2017 est. | 4.348 | Africa | ||
| 43 | 12,500 | 2017 est. | 2,900 | 2015 est. | 4.310 | Asia | ||
| 44 | 24,500 | 2017 est. | 5,700 | 2017 est. | 4.298 | Europe | ||
| 45 | 3,200 | 2017 est. | 800 | 2017 est. | 4.000 | Africa | ||
| 46 | 66,200 | 2017 est. | 17,000 | 2017 est. | 3.894 | Asia | ||
| 47 | 26,300 | 2017 est. | 6,900 | 2017 est. | 3.812 | Asia | ||
| 48 | 33,000 | 2017 est. | 8,700 | 2017 est. | 3.793 | Europe | ||
| 49 | 13,500 | 2017 est. | 3,600 | 2017 est. | 3.750 | Africa | ||
| 50 | 20,200 | 2017 est. | 5,400 | 2017 est. | 3.741 | Asia | ||
| 51 | 61,400 | 2017 est. | 16,700 | 2017 est. | 3.677 | Asia | ||
| 52 | 15,200 | 2017 est. | 4,400 | 2017 est. | 3.455 | Africa | ||
| 53 | 6,900 | 2017 est. | 2,000 | 2017 est. | 3.450 | Asia | ||
| 54 | 8,600 | 2017 est. | 2,500 | 2007 est. | 3.440 | Africa | ||
| 55 | 29,500 | 2017 est. | 8,700 | 2017 est. | 3.391 | Europe | ||
| 56 | 29,500 | 2017 est. | 8,700 | 2017 est. | 3.391 | Europe | ||
| 57 | 12,400 | 2017 est. | 3,700 | 2017 est. | 3.351 | Asia / Oceania | ||
| 58 | 4,000 | 2017 est. | 1,200 | 2017 est. | 3.333 | Africa | ||
| 59 | 4,000 | 2017 est. | 1,200 | 2017 est. | 3.333 | Africa | ||
| 60 | 2,300 | 2017 est. | 700 | 2017 est. | 3.286 | Africa | ||
| 61 | 24,500 | 2017 est. | 7,500 | 2017 est. | 3.267 | Americas | ||
| 62 | 54,800 | 2017 est. | 17,000 | 2017 est. | 3.224 | Asia | ||
| 63 | 27,800 | 2017 est. | 8,700 | 2017 est. | 3.195 | Europe | ||
| 64 | 16,700 | 2017 est. | 5,400 | 2017 est. | 3.093 | Asia | ||
| 65 | 4,600 | 2017 est. | 1,500 | 2017 est. | 3.067 | Africa | ||
| 66 | 2,100 | 2017 est. | 700 | 2017 est. | 3.000 | Africa | ||
| 67 | 2,400 | 2017 est. | 800 | 2017 est. | 3.000 | Africa | ||
| 68 | 59,500 | 2017 est. | 19,900 | 2017 est. | 2.990 | Americas | ||
| 69 | 12,700 | 2017 est. | 4,300 | 2014 est. | 2.953 | Africa / Asia | ||
| 70 | 16,900 | 2017 est. | 5,800 | 2017 est. | 2.914 | Americas | ||
| 71 | 19,200 | 2017 est. | 6,600 | 2017 est. | 2.909 | Africa | ||
| 72 | 12,500 | 2017 est. | 4,300 | 2014 est. | 2.907 | Asia | ||
| 73 | 36,300 | 2017 est. | 12,500 | 2017 est. | 2.904 | Asia | ||
| 74 | 17,900 | 2017 est. | 6,200 | 2017 est. | 2.887 | Asia | ||
| 75 | 4,600 | 2017 est. | 1,600 | 2017 est. | 2.875 | Africa | ||
| 76 | 36,300 | 2017 est. | 12,700 | 2017 est. | 2.858 | Asia / Africa | ||
| 77 | 26,900 | 2017 est. | 9,500 | 2017 est. | 2.832 | Asia | ||
| 78 | 11,300 | 2017 est. | 4,000 | 2017 est. | 2.825 | Africa | ||
| 79 | 24,500 | 2017 est. | 8,700 | 2017 est. | 2.816 | Europe | ||
| 80 | 139,100 | 2009 est. | 49,900 | 2017 est. | 2.788 | Europe | ||
| 81 | 20,900 | 2017 est. | 7,500 | 2017 est. | 2.787 | Americas | ||
| 82 | 3,900 | 2017 est. | 1,400 | 2017 est. | 2.786 | Africa | ||
| 83 | 4,700 | 2017 est. | 1,700 | 2017 est. | 2.765 | Africa | ||
| 84 | 12,700 | 2017 est. | 4,600 | 2017 est. | 2.761 | Africa | ||
| 85 | 5,400 | 2017 est. | 2,000 | 2017 est. | 2.700 | Asia | ||
| 86 | 78,200 | 2017 est. | 29,000 | 2017 est. | 2.697 | Asia | ||
| 87 | 16,700 | 2017 est. | 6,200 | 2017 est. | 2.694 | Asia | ||
| 88 | 7,200 | 2017 est. | 2,700 | 2017 est. | 2.667 | Asia | ||
| 89 | 3,200 | 2017 est. | 1,200 | 2017 est. | 2.667 | Africa | ||
| 90 | 3,200 | 2017 est. | 1,200 | 2017 est. | 2.667 | Africa | ||
| 91 | 115,700 | 2015 est. | 43,800 | 2017 est. | 2.642 | Europe | ||
| 92 | 2,100 | 2017 est. | 800 | 2017 est. | 2.625 | Africa | ||
| 93 | 18,100 | 2017 est. | 6,900 | 2017 est. | 2.623 | Asia | ||
| 94 | 27,800 | 2017 est. | 10,700 | 2017 est. | 2.598 | Europe / Asia | ||
| 95 | 71,800 | 2017 est. | 27,800 | 2017 est. | 2.583 | Europe | ||
| 96 | 5,900 | 2017 est. | 2,300 | 2017 est. | 2.565 | Africa | ||
| 97 | 5,900 | 2017 est. | 2,300 | 2017 est. | 2.565 | Africa | ||
| 98 | 26,900 | 2017 est. | 10,700 | 2017 est. | 2.514 | Asia | ||
| 99 | 4,700 | 2017 est. | 1,900 | 2017 est. | 2.474 | Africa | ||
| 100 | 19,900 | 2017 est. | 8,100 | 2017 est. | 2.457 | Americas | ||
| 101 | 106,300 | 2017 est. | 43,800 | 2017 est. | 2.427 | Europe | ||
| 102 | 16,700 | 2017 est. | 6,900 | 2017 est. | 2.420 | Asia | ||
| 103 | 17,900 | 2017 est. | 7,400 | 2017 est. | 2.419 | Asia | ||
| 104 | 19,900 | 2017 est. | 8,300 | 2017 est. | 2.398 | Americas | ||
| 105 | 29,000 | 2017 est. | 12,400 | 2017 est. | 2.339 | Asia | ||
| 106 | 3,500 | 2017 est. | 1,500 | 2017 est. | 2.333 | Africa | ||
| 107 | 16,700 | 2017 est. | 7,200 | 2017 est. | 2.319 | Asia | ||
| 108 | 12,400 | 2017 est. | 5,400 | 2017 est. | 2.296 | Asia | ||
| 109 | 106,300 | 2017 est. | 46,600 | 2017 est. | 2.281 | Europe | ||
| 110 | 124,500 | 2017 est. | 54,800 | 2017 est. | 2.272 | Asia | ||
| 111 | 139,100 | 2009 est. | 61,400 | 2017 est. | 2.265 | Europe | ||
| 112 | 16,700 | 2017 est. | 7,400 | 2017 est. | 2.257 | Asia | ||
| 113 | 3,600 | 2017 est. | 1,600 | 2017 est. | 2.250 | Africa | ||
| 114 | 27,700 | 2017 est. | 12,500 | 2017 est. | 2.216 | Europe | ||
| 115 | 10,000 | 2017 est. | 4,600 | 2017 est. | 2.174 | Africa | ||
| 116 | 18,900 | 2017 est. | 8,700 | 2017 est. | 2.172 | Europe | ||
| 117 | 6,900 | 2017 est. | 3,200 | 2017 est. | 2.156 | Asia | ||
| 118 | 1,500 | 2017 est. | 700 | 2017 est. | 2.143 | Africa | ||
| 119 | 27,800 | 2017 est. | 13,000 | 2017 est. | 2.138 | Europe / Asia | ||
| 120 | 20,900 | 2017 est. | 9,800 | 2017 est. | 2.133 | Americas | ||
| 121 | 20,200 | 2017 est. | 9,500 | 2017 est. | 2.126 | Asia | ||
| 122 | 106,300 | 2017 est. | 50,400 | 2017 est. | 2.109 | Europe | ||
| 123 | 4,600 | 2017 est. | 2,200 | 2017 est. | 2.091 | Africa | ||
| 124 | 15,600 | 2017 est. | 7,500 | 2017 est. | 2.080 | Americas | ||
| 125 | 3,900 | 2017 est. | 1,900 | 2017 est. | 2.053 | Africa | ||
| 126 | 4,400 | 2017 est. | 2,200 | 2017 est. | 2.000 | Africa | ||
| 127 | 4,600 | 2017 est. | 2,300 | 2017 est. | 2.000 | Africa |