List of countries by trade-to-GDP ratio

Last updated

World map by trade as a share of GDP. Trade-as-share-of-gdp.png
World map by trade as a share of GDP.

This is the list of countries by trade-to-GDP ratio, i.e. the sum of exports and imports of goods and services, divided by gross domestic product, expressed as a percentage, based on the data published by World Bank. The trade-to-GDP ratio is also known as the "trade openness index". [1] The list includes sovereign states and self-governing dependent territories based upon the ISO standard ISO 3166-1.

List of countries by trade-to-GDP ratio

The following table provides information on exports [2] and imports [3] of goods and services, based on the data published by World Bank, trade openness index, calculated as their sum, and the ratio between exports and imports.

Sorting is alphabetical by country code, according to ISO 3166-1 alpha-3.

Country/Territory/Region/GroupExports
(% of GDP)
Imports
(% of GDP)
Trade
Openness
Index
(% of GDP)
Export/
Import
ratio
Year
Flag of the United Nations.svg WORLD30.96%30.48%61.44%1.022022
Flag of Aruba.svg   Aruba 83.12%77.33%160.46%1.072022
Flag of the Taliban.svg   Afghanistan 14.34%37.07%51.41%0.392021
Flag of Angola.svg   Angola 43.42%24.75%68.17%1.752022
Flag of Albania.svg   Albania 37.40%47.75%85.15%0.782022
Flag of the United Arab Emirates.svg   United Arab Emirates 95.93%70.65%166.57%1.362020
Flag of Argentina.svg   Argentina 16.30%15.35%31.65%1.062022
Flag of Armenia.svg   Armenia 50.01%50.99%101.01%0.982022
Flag of American Samoa.svg   American Samoa 46.96%77.73%124.68%0.602022
Flag of Antigua and Barbuda.svg   Antigua and Barbuda 54.69%62.94%117.63%0.872022
Flag of Australia (converted).svg   Australia 25.43%19.71%45.14%1.292022
Flag of Austria.svg   Austria 62.08%61.60%123.69%1.012022
Flag of Azerbaijan.svg   Azerbaijan 60.05%27.03%87.08%2.222022
Flag of Burundi.svg   Burundi 4.97%23.34%28.32%0.212022
Flag of Belgium (civil).svg   Belgium 95.73%97.36%193.09%0.982022
Flag of Benin.svg   Benin 21.65%29.28%50.93%0.742022
Flag of Burkina Faso.svg   Burkina Faso 31.75%33.10%64.85%0.962022
Flag of Bangladesh.svg   Bangladesh 12.88%20.90%33.78%0.622022
Flag of Bulgaria.svg   Bulgaria 69.19%68.99%138.18%1.002022
Flag of Bahrain.svg   Bahrain 89.68%70.19%159.87%1.282021
Flag of the Bahamas.svg   Bahamas 37.53%42.67%80.20%0.882022
Flag of Bosnia and Herzegovina.svg   Bosnia and Herzegovina 48.25%62.04%110.28%0.782022
Flag of Belarus.svg   Belarus 63.71%57.87%121.58%1.102022
Flag of Belize.svg   Belize 52.37%55.58%107.95%0.942022
Flag of Bermuda.svg   Bermuda 52.35%25.98%78.33%2.012022
Bandera de Bolivia (Estado).svg   Bolivia 32.61%35.14%67.76%0.932022
Flag of Brazil.svg   Brazil 20.05%19.29%39.34%1.042022
Flag of Barbados.svg   Barbados 35.13%43.22%78.35%0.812022
Flag of Brunei.svg   Brunei Darussalam 86.39%60.58%146.97%1.432022
Flag of Bhutan.svg   Bhutan 29.20%48.38%77.58%0.602021
Flag of Botswana.svg   Botswana 43.47%42.00%85.47%1.042022
Flag of the Central African Republic.svg   Central African Republic 12.30%32.93%45.23%0.372022
Flag of Canada (Pantone).svg   Canada 33.79%33.65%67.44%1.002022
Flag of Switzerland (Pantone).svg   Switzerland 76.94%63.23%140.17%1.222022
Flag of Chile.svg   Chile 35.67%39.35%75.02%0.912022
Flag of the People's Republic of China.svg   China 20.68%17.47%38.14%1.182022
Flag of Cote d'Ivoire.svg   Cote d'Ivoire 24.84%27.49%52.34%0.902022
Flag of Cameroon.svg   Cameroon 19.29%22.00%41.29%0.882022
Flag of the Democratic Republic of the Congo.svg   Congo, Dem. Rep. 46.19%48.97%95.16%0.942022
Flag of the Republic of the Congo.svg   Congo 63.81%34.35%98.16%1.862022
Flag of Colombia.svg   Colombia 20.58%27.78%48.37%0.742022
Flag of the Comoros.svg   Comoros 12.72%35.07%47.78%0.362022
Flag of Cape Verde.svg   Cape Verde 40.96%56.71%97.67%0.722022
Flag of Costa Rica.svg   Costa Rica 40.57%39.09%79.66%1.042022
Flag of Cuba.svg   Cuba 40.01%48.79%88.80%0.822022
Flag of Curacao.svg   Curacao 63.25%92.02%155.27%0.692018
Flag of the Cayman Islands.svg   Cayman Islands 59.72%45.91%105.62%1.302020
Flag of Cyprus.svg   Cyprus 95.04%94.72%189.76%1.002022
Flag of the Czech Republic.svg   Czechia 76.45%75.48%151.93%1.012022
Flag of Germany.svg   Germany 50.92%48.96%99.88%1.042022
Flag of Djibouti.svg   Djibouti 169.00%171.19%340.19%0.992022
Flag of Dominica.svg   Dominica 29.19%77.77%106.96%0.382018
Flag of Denmark.svg   Denmark 70.01%58.92%128.93%1.192022
Flag of the Dominican Republic.svg   Dominican Republic 22.06%32.17%54.23%0.692022
Flag of Algeria.svg   Algeria 35.34%23.71%59.04%1.492022
Flag of Ecuador.svg   Ecuador 29.17%28.52%57.69%1.022022
Flag of Egypt.svg   Egypt 15.09%21.90%36.98%0.692022
Flag of Eritrea.svg   Eritrea 18.15%29.24%47.39%0.622011
Flag of Spain.svg   Spain 40.87%39.66%80.54%1.032022
Flag of Estonia.svg   Estonia 85.50%86.07%171.57%0.992022
Flag of Ethiopia.svg   Ethiopia 8.25%18.32%26.57%0.452022
Flag of Finland.svg   Finland 45.30%47.69%92.99%0.952022
Flag of Fiji.svg   Fiji 48.07%69.19%117.26%0.692022
Flag of France.svg   France 34.69%38.56%73.25%0.902022
Flag of the Faroe Islands.svg   Faroe Islands 62.40%62.51%124.91%1.002022
Flag of the Federated States of Micronesia.svg   Micronesia 31.84%75.94%107.78%0.422022
Flag of Gabon.svg   Gabon 61.38%16.60%77.99%3.702022
Flag of the United Kingdom.svg   United Kingdom 33.27%35.98%69.26%0.922022
Flag of Georgia.svg   Georgia 52.91%62.73%115.64%0.842022
Flag of Ghana.svg   Ghana 34.90%35.69%70.59%0.982022
Flag of Guinea.svg   Guinea 43.67%63.81%107.48%0.682022
Flag of The Gambia.svg   Gambia 4.57%30.77%35.34%0.152022
Flag of Guinea-Bissau.svg   Guinea-Bissau 14.39%29.25%43.64%0.492020
Flag of Equatorial Guinea.svg   Equatorial Guinea 51.80%35.72%87.52%1.452022
Flag of Greece.svg   Greece 49.14%58.86%108.00%0.832022
Flag of Greenland.svg   Greenland 35.44%49.72%85.15%0.712021
Flag of Guatemala.svg   Guatemala 19.02%35.65%54.67%0.532022
Flag of Guam.svg   Guam 3.04%59.89%62.93%0.052021
Flag of Guyana.svg   Guyana 84.62%109.73%194.35%0.772005
Flag of Hong Kong.svg   Hong Kong 193.86%189.93%383.79%1.022022
Flag of Honduras.svg   Honduras 41.92%69.16%111.07%0.612022
Flag of Croatia.svg   Croatia 59.17%65.35%124.52%0.912022
Flag of Haiti.svg   Haiti 7.24%29.29%36.53%0.252022
Flag of Hungary.svg   Hungary 91.21%95.52%186.72%0.952022
Flag of Indonesia.svg   Indonesia 24.49%20.90%45.39%1.172022
Flag of India.svg   India 22.79%26.44%49.23%0.862022
Flag of Ireland.svg   Ireland 137.09%97.18%234.27%1.412022
Flag of Iran.svg   Iran 26.82%24.78%51.60%1.082022
Flag of Iraq.svg   Iraq 37.68%24.41%62.10%1.542021
Flag of Iceland.svg   Iceland 46.58%46.99%93.57%0.992022
Flag of Israel.svg   Israel 31.73%28.78%60.50%1.102022
Flag of Italy.svg   Italy 36.63%38.15%74.78%0.962022
Flag of Jamaica.svg   Jamaica 38.04%52.07%90.11%0.732019
Flag of Jordan.svg   Jordan 36.67%49.15%85.82%0.752019
Flag of Japan.svg   Japan 21.57%25.40%46.97%0.852022
Flag of Kazakhstan.svg   Kazakhstan 41.78%26.33%68.11%1.592022
Flag of Kenya.svg   Kenya 12.22%21.51%33.73%0.572022
Flag of Kyrgyzstan (2023).svg   Kyrgyzstan 31.60%67.27%98.88%0.472018
Flag of Cambodia.svg   Cambodia 68.34%54.85%123.19%1.252022
Flag of Kiribati.svg   Kiribati 9.63%96.27%105.90%0.102022
Flag of South Korea.svg   South Korea 48.27%48.26%96.54%1.002022
Flag of Kuwait.svg   Kuwait 53.29%44.89%98.18%1.192019
Flag of Laos.svg   Laos 33.21%41.88%75.09%0.792016
Flag of Lebanon.svg   Lebanon 26.03%52.80%78.83%0.492021
Flag of Libya.svg   Libya 42.84%35.37%78.21%1.212019
Flag of Sri Lanka.svg   Sri Lanka 21.48%25.04%46.52%0.862022
Flag of Lesotho.svg   Lesotho 48.34%100.85%149.19%0.482022
Flag of Lithuania.svg   Lithuania 86.85%88.86%175.70%0.982022
Flag of Luxembourg.svg   Luxembourg 211.28%177.24%388.51%1.192022
Flag of Latvia.svg   Latvia 71.99%76.52%148.50%0.942022
Flag of Macau.svg   Macao 87.28%90.65%177.93%0.962022
Flag of Morocco.svg   Morocco 44.81%56.31%101.12%0.802022
Flag of Moldova.svg   Moldova 41.24%69.49%110.73%0.592022
Flag of Madagascar.svg   Madagascar 30.37%39.23%69.60%0.772022
Flag of Mexico.svg   Mexico 42.64%45.47%88.11%0.942022
Flag of the Marshall Islands.svg   Marshall Islands 46.27%73.67%119.94%0.632022
Flag of North Macedonia.svg   North Macedonia 74.89%95.92%170.82%0.782022
Flag of Mali.svg   Mali 29.06%39.77%68.83%0.732022
Flag of Malta.svg   Malta 165.29%152.45%317.75%1.082022
Flag of Montenegro.svg   Montenegro 51.53%74.37%125.90%0.692022
Flag of Mongolia.svg   Mongolia 65.06%71.27%136.33%0.912022
Flag of the Northern Mariana Islands.svg   Northern Mariana Islands 14.92%62.47%77.39%0.242020
Flag of Mauritania.svg   Mauritania 49.15%54.81%103.95%0.902022
Flag of Mauritius.svg   Mauritius 56.66%62.78%119.44%0.902022
Flag of Malaysia.svg   Malaysia 76.95%69.71%146.66%1.102022
Flag of Namibia.svg   Namibia 36.74%55.03%91.77%0.672022
Flags of New Caledonia.svg   New Caledonia 21.01%37.92%58.93%0.552017
Flag of Niger.svg   Niger 8.72%26.58%35.30%0.332022
Flag of Nigeria.svg   Nigeria 9.24%16.92%26.17%0.551960
Flag of Nicaragua.svg   Nicaragua 49.78%65.40%115.18%0.762022
Flag of the Netherlands.svg   Netherlands 93.75%82.96%176.71%1.132022
Flag of Norway.svg   Norway 55.66%27.31%82.97%2.042022
Flag of Nepal.svg   Nepal 6.76%42.64%49.40%0.162022
Flag of Nauru.svg   Nauru 55.50%114.83%170.33%0.482022
Flag of New Zealand.svg   New Zealand 24.24%29.56%53.81%0.822022
Flag of Oman.svg   Oman 52.53%41.39%93.92%1.272021
Flag of Pakistan.svg   Pakistan 10.55%22.50%33.05%0.472022
Flag of Panama.svg   Panama 41.80%45.62%87.43%0.922017
Flag of Peru.svg   Peru 29.32%29.09%58.41%1.012022
Flag of the Philippines.svg   Philippines 28.39%44.03%72.42%0.642022
Flag of Papua New Guinea.svg   Papua New Guinea 72.16%58.92%131.08%1.222004
Flag of Poland.svg   Poland 62.69%61.25%123.93%1.022022
Flag of Puerto Rico.svg   Puerto Rico 52.71%45.41%98.11%1.162022
Flag of Portugal.svg   Portugal 49.60%52.01%101.61%0.952022
Flag of Paraguay.svg   Paraguay 34.48%39.38%73.85%0.882022
Flag of Palestine.svg   Palestine 18.54%67.36%85.90%0.282022
Flag of French Polynesia.svg   French Polynesia 21.10%46.13%67.23%0.462022
Flag of Qatar.svg   Qatar 68.44%31.54%99.98%2.172022
Flag of Romania.svg   Romania 42.97%49.84%92.82%0.862022
Flag of Russia.svg   Russian Federation 28.19%15.59%43.77%1.812022
Flag of Rwanda.svg   Rwanda 22.49%38.68%61.17%0.582022
Flag of Saudi Arabia.svg   Saudi Arabia 40.22%23.29%63.51%1.732022
Flag of Sudan.svg   Sudan 1.57%1.13%2.70%1.392022
Flag of Senegal.svg   Senegal 26.96%52.91%79.87%0.512022
Flag of Singapore.svg   Singapore 186.55%150.31%336.86%1.242022
Flag of the Solomon Islands.svg   Solomon Islands 27.94%32.28%60.22%0.872020
Flag of Sierra Leone.svg   Sierra Leone 31.88%56.22%88.09%0.572022
Flag of El Salvador.svg   El Salvador 31.18%55.62%86.80%0.562022
Flag of San Marino.svg   San Marino 184.31%158.16%342.47%1.172021
Flag of Somalia.svg   Somalia 17.31%78.53%95.84%0.222022
Flag of Serbia.svg   Serbia 63.84%74.81%138.65%0.852022
Flag of South Sudan.svg   South Sudan 36.65%28.90%65.55%1.272015
Flag of Suriname.svg   Suriname 52.55%38.41%90.96%1.372010
Flag of Slovakia.svg   Slovakia 99.36%104.76%204.12%0.952022
Flag of Slovenia.svg   Slovenia 94.15%91.88%186.03%1.022022
Flag of Sweden.svg   Sweden 52.80%49.87%102.67%1.062022
Flag of Eswatini.svg   Eswatini 43.83%47.59%91.42%0.922022
Flag of Seychelles.svg   Seychelles 111.46%121.61%233.07%0.922022
Flag of Syria.svg   Syria 24.80%73.06%97.85%0.342021
Flag of Chad.svg   Chad 51.19%39.57%90.76%1.292022
Flag of Togo.svg   Togo 23.97%33.87%57.84%0.712022
Flag of Thailand.svg   Thailand 65.78%68.10%133.88%0.972022
Flag of Tajikistan.svg   Tajikistan 24.18%47.64%71.83%0.512021
Flag of Turkmenistan.svg   Turkmenistan 20.56%12.50%33.06%1.652021
Flag of East Timor.svg   Timor-Leste 55.68%41.96%97.64%1.332022
Flag of Tonga.svg   Tonga 12.52%60.84%73.37%0.212021
Flag of Tunisia.svg   Tunisia 49.36%61.38%110.74%0.802022
Flag of Turkey.svg   Turkey 38.58%42.59%81.17%0.912022
Flag of Tanzania.svg   Tanzania 15.42%19.60%35.02%0.792022
Flag of Uganda.svg   Uganda 12.02%22.48%34.51%0.532022
Flag of Ukraine.svg   Ukraine 35.46%52.25%87.71%0.682022
Flag of Uruguay.svg   Uruguay 31.32%25.87%57.19%1.212022
Flag of the United States.svg   United States 10.89%14.59%25.48%0.752021
Flag of Uzbekistan.svg   Uzbekistan 27.27%44.31%71.58%0.622022
Flag of Venezuela.svg   Venezuela 16.69%31.40%48.09%0.532014
Flag of the United States Virgin Islands.svg   U.S. Virgin Islands 91.70%91.47%183.17%1.002021
Flag of Vietnam.svg   Viet Nam 93.99%91.74%185.73%1.022022
Flag of Vanuatu.svg   Vanuatu 14.82%53.69%68.51%0.282022
Flag of Samoa.svg   Samoa 12.27%52.72%64.98%0.232022
Flag of Kosovo.svg   Kosovo 38.45%71.06%109.51%0.542022
Flag of Yemen.svg   Yemen 8.76%50.15%58.90%0.172018
Flag of South Africa.svg   South Africa 33.54%31.52%65.06%1.062022
Flag of Zambia.svg   Zambia 40.19%29.10%69.30%1.382022
Flag of Zimbabwe.svg   Zimbabwe 27.96%37.00%64.96%0.762022
Pacific island small states 36.90%65.58%102.48%0.562022
Least developed countries: UN classification22.58%31.94%54.51%0.712022
Low & middle income (WB)26.31%25.36%51.67%1.042022
Low-income 21.78%36.33%58.11%0.602022
Middle-income (WB)26.39%25.21%51.60%1.052022
Lower middle income (WB)27.81%32.19%60.00%0.862022
Upper middle income (WB)26.09%23.38%49.47%1.122022
High-income 33.92%33.82%67.73%1.002022
European Union 56.31%54.50%110.81%1.032022
OECD (Organisation for Economic Cooperation and Development)30.44%31.72%62.16%0.962022

Related Research Articles

<span class="mw-page-title-main">Economy of Benin</span>

The economy of Benin remains underdeveloped and dependent on subsistence agriculture and cotton. Cotton accounts for 40% of Benin's GDP and roughly 80% of official export receipts. There is also production of textiles, palm products, and cocoa beans. Maize (corn), beans, rice, peanuts, cashews, pineapples, cassava, yams, and other various tubers are grown for local subsistence. Benin began producing a modest quantity of offshore oil in October 1982. Production ceased in recent years but exploration of new sites is ongoing.

<span class="mw-page-title-main">Economy of Burkina Faso</span>

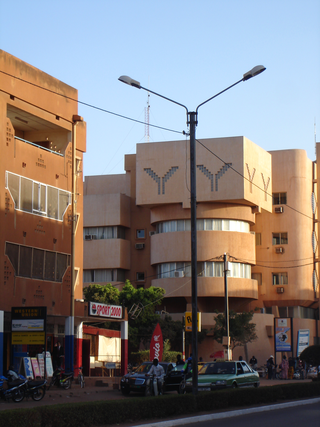
The economy of Burkina Faso is based primarily on subsistence farming and livestock raising. Burkina Faso has an average income purchasing-power-parity per capita of $1,900 and nominal per capita of $790 in 2014. More than 80% of the population relies on subsistence agriculture, with only a small fraction directly involved in industry and services. Highly variable rainfall, poor soils, lack of adequate communications and other infrastructure, a low literacy rate, and a stagnant economy are all longstanding problems of this landlocked country. The export economy also remained subject to fluctuations in world prices.

<span class="mw-page-title-main">Economy of Kyrgyzstan</span>

The economy of Kyrgyzstan is heavily dependent on the agricultural sector. Cotton, tobacco, wool, and meat are the main agricultural products, although only tobacco and cotton are exported in any quantity. According to Healy Consultants, Kyrgyzstan's economy relies heavily on the strength of industrial exports, with plentiful reserves of gold, mercury and uranium. The economy also relies heavily on remittances from foreign workers. Following independence, Kyrgyzstan was progressive in carrying out market reforms, such as an improved regulatory system and land reform. In 1998, Kyrgyzstan was the first Commonwealth of Independent States (CIS) country to be accepted into the World Trade Organization. Much of the government's stock in enterprises has been sold. Kyrgyzstan's economic performance has been hindered by widespread corruption, low foreign investment and general regional instability. Despite those issues, Kyrgyzstan is ranked 70th on the ease of doing business index.

<span class="mw-page-title-main">Economy of Malawi</span>

The economy of Malawi is $7.522 billion by gross domestic product as of 2019, and is predominantly agricultural, with about 80% of the population living in rural areas. The landlocked country in south central Africa ranks among the world's least developed countries. In 2017, agriculture accounted for about one-third of GDP and about 80% of export revenue. The economy depends on substantial inflows of economic assistance from the IMF, the World Bank, and individual donor nations. The government faces strong challenges: to spur exports, to improve educational and health facilities, to face up to environmental problems of deforestation and erosion, and to deal with the problem of HIV/AIDS in Africa. Malawi is a least developed country according to United Nations.

<span class="mw-page-title-main">Economy of Mongolia</span>

The economy of Mongolia has traditionally been based on agriculture and livestock. Mongolia also has extensive mineral deposits: copper, coal, molybdenum, tin, tungsten, and gold account for a large part of industrial production. Soviet assistance, at its height one-third of Gross domestic product (GDP), disappeared almost overnight in 1990–91, in the time of the collapse of the Soviet Union. Mongolia was driven into deep recession.

<span class="mw-page-title-main">Economy of Nepal</span>

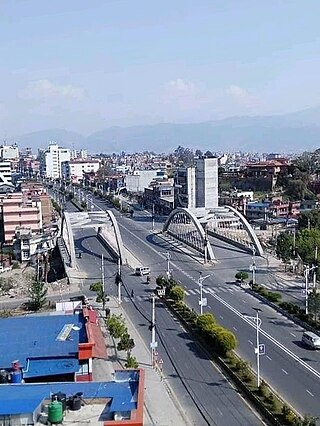
The economy of Nepal is developing category and largely dependent on agriculture and remittances. Until the mid-20th century Nepal was an isolated pre-industrial society, which entered the modern era in 1951 without schools, hospitals, roads, telecommunications, electric power, industry, or civil service. The country has, however, made progress toward sustainable economic growth since the 1950s. The country was opened to economic liberalization, leading to economic growth and improvement in living standards when compared to the past. The biggest challenges faced by the country in achieving higher economic development are the frequent changes in political leadership, as well as corruption.

<span class="mw-page-title-main">Economy of Nicaragua</span>

The economy of Nicaragua is focused primarily on the agricultural sector. Nicaragua itself is the least developed country in Central America, and the second poorest in the Americas by nominal GDP. In recent years, under the administrations of Daniel Ortega, the Nicaraguan economy has expanded somewhat, following the Great Recession, when the country's economy actually contracted by 1.5%, due to decreased export demand in the American and Central American markets, lower commodity prices for key agricultural exports, and low remittance growth. The economy saw 4.5% growth in 2010 thanks to a recovery in export demand and growth in its tourism industry. Nicaragua's economy continues to post growth, with preliminary indicators showing the Nicaraguan economy growing an additional 5% in 2011. Consumer Price inflation have also curtailed since 2008, when Nicaragua's inflation rate hovered at 19.82%. In 2009 and 2010, the country posted lower inflation rates, 3.68% and 5.45%, respectively. Remittances are a major source of income, equivalent to 15% of the country's GDP, which originate primarily from Costa Rica, the United States, and European Union member states. Approximately one million Nicaraguans contribute to the remittance sector of the economy.

<span class="mw-page-title-main">Economy of the Republic of the Congo</span>

The economy of the Republic of the Congo is a mixture of subsistence hunting and agriculture, an industrial sector based largely on petroleum extraction and support services. Government spending is characterized by budget problems and overstaffing. Petroleum has supplanted forestry as the mainstay of the economy, providing a major share of government revenues and exports. Nowadays the Republic of the Congo is increasingly converting natural gas to electricity rather than burning it, greatly improving energy prospects.

<span class="mw-page-title-main">Economy of Senegal</span>

The economy of Senegal is driven by mining, construction, tourism, fishing and agriculture, which are the main sources of employment in rural areas, despite abundant natural resources in iron, zircon, gas, gold, phosphates, and numerous oil discoveries recently. Senegal's economy gains most of its foreign exchange from fish, phosphates, groundnuts, tourism, and services. As one of the dominant parts of the economy, the agricultural sector of Senegal is highly vulnerable to environmental conditions, such as variations in rainfall and climate change, and changes in world commodity prices.

<span class="mw-page-title-main">Economy of the Gambia</span>

The economy of the Gambia is heavily reliant on agriculture. The Gambia has no significant mineral or other natural resources, and has a limited agricultural base. About 75% of the population depends on crops and livestock for its livelihood. Small-scale manufacturing activity features the processing of peanuts, fish, and animal hides.

<span class="mw-page-title-main">Economy of Algeria</span>

Algeria's economy continued to recover in the first half of 2022, led by a return of oil production to pre-pandemic levels and a continued recovery of the service sector along with a more vigorous agricultural activity. The recovery should continue into 2023, supported by the nonhydrocarbon sector and public expenditure growth, according to the latest edition of the World Bank's Algeria Economic Update.

References

  1. 1 2 Our World in Data. "Trade as a share of GDP". ourworldindata.org. Retrieved 2024-01-10.
  2. World Bank. "Exports of goods and services (% of GDP)". data.worldbank.org. Retrieved 2024-01-10.
  3. World Bank. "Imports of goods and services (% of GDP)". data.worldbank.org. Retrieved 2024-01-10.