
In mathematics, a fractal is a geometric shape containing detailed structure at arbitrarily small scales, usually having a fractal dimension strictly exceeding the topological dimension. Many fractals appear similar at various scales, as illustrated in successive magnifications of the Mandelbrot set. This exhibition of similar patterns at increasingly smaller scales is called self-similarity, also known as expanding symmetry or unfolding symmetry; if this replication is exactly the same at every scale, as in the Menger sponge, the shape is called affine self-similar. Fractal geometry lies within the mathematical branch of measure theory.

The Mandelbrot set is a two-dimensional set with a relatively simple definition that exhibits great complexity, especially as it is magnified. It is popular for its aesthetic appeal and fractal structures. The set is defined in the complex plane as the complex numbers for which the function does not diverge to infinity when iterated starting at , i.e., for which the sequence , , etc., remains bounded in absolute value.

In mathematics, a self-similar object is exactly or approximately similar to a part of itself. Many objects in the real world, such as coastlines, are statistically self-similar: parts of them show the same statistical properties at many scales. Self-similarity is a typical property of fractals. Scale invariance is an exact form of self-similarity where at any magnification there is a smaller piece of the object that is similar to the whole. For instance, a side of the Koch snowflake is both symmetrical and scale-invariant; it can be continually magnified 3x without changing shape. The non-trivial similarity evident in fractals is distinguished by their fine structure, or detail on arbitrarily small scales. As a counterexample, whereas any portion of a straight line may resemble the whole, further detail is not revealed.

2D computer graphics is the computer-based generation of digital images—mostly from two-dimensional models and by techniques specific to them. It may refer to the branch of computer science that comprises such techniques or to the models themselves.

Fractal art is a form of algorithmic art created by calculating fractal objects and representing the calculation results as still digital images, animations, and media. Fractal art developed from the mid-1980s onwards. It is a genre of computer art and digital art which are part of new media art. The mathematical beauty of fractals lies at the intersection of generative art and computer art. They combine to produce a type of abstract art.
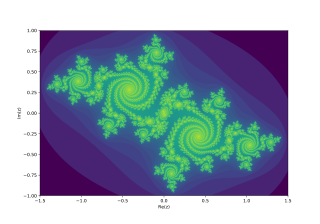
In the context of complex dynamics, a branch of mathematics, the Julia set and the Fatou set are two complementary sets defined from a function. Informally, the Fatou set of the function consists of values with the property that all nearby values behave similarly under repeated iteration of the function, and the Julia set consists of values such that an arbitrarily small perturbation can cause drastic changes in the sequence of iterated function values. Thus the behavior of the function on the Fatou set is "regular", while on the Julia set its behavior is "chaotic".

Clifford Alan Pickover is an American author, editor, and columnist in the fields of science, mathematics, science fiction, innovation, and creativity. For many years, he was employed at the IBM Thomas J. Watson Research Center in Yorktown, New York, where he was editor-in-chief of the IBM Journal of Research and Development. He has been granted more than 700 U.S. patents, is an elected Fellow for the Committee for Skeptical Inquiry, and is author of more than 50 books, translated into more than a dozen languages.

The Buddhabrot is the probability distribution over the trajectories of points that escape the Mandelbrot fractal. Its name reflects its pareidolic resemblance to classical depictions of Gautama Buddha, seated in a meditation pose with a forehead mark (tikka), a traditional oval crown (ushnisha), and ringlet of hair.
The computer graphics pipeline, also known as the rendering pipeline or graphics pipeline, is a framework within computer graphics that outlines the necessary procedures for transforming a three-dimensional (3D) scene into a two-dimensional (2D) representation on a screen. Once a 3D model is generated, the graphics pipeline converts the model into a visually perceivable format on the computer display. Due to the dependence on specific software, hardware configurations, and desired display attributes, a universally applicable graphics pipeline does not exist. Nevertheless, graphics application programming interfaces (APIs), such as Direct3D, OpenGL and Vulkan were developed to standardize common procedures and oversee the graphics pipeline of a given hardware accelerator. These APIs provide an abstraction layer over the underlying hardware, relieving programmers from the need to write code explicitly targeting various graphics hardware accelerators like AMD, Intel, Nvidia, and others.

The Newton fractal is a boundary set in the complex plane which is characterized by Newton's method applied to a fixed polynomial p(z) ∈ [z] or transcendental function. It is the Julia set of the meromorphic function z ↦ z − p(z)/p′(z) which is given by Newton's method. When there are no attractive cycles (of order greater than 1), it divides the complex plane into regions Gk, each of which is associated with a root ζk of the polynomial, k = 1, …, deg(p). In this way the Newton fractal is similar to the Mandelbrot set, and like other fractals it exhibits an intricate appearance arising from a simple description. It is relevant to numerical analysis because it shows that (outside the region of quadratic convergence) the Newton method can be very sensitive to its choice of start point.
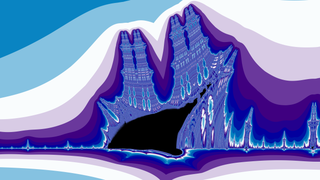
The Burning Ship fractal, first described and created by Michael Michelitsch and Otto E. Rössler in 1992, is generated by iterating the function:
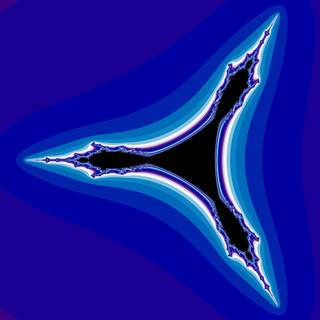
In mathematics, the tricorn, sometimes called the Mandelbar set, is a fractal defined in a similar way to the Mandelbrot set, but using the mapping instead of used for the Mandelbrot set. It was introduced by W. D. Crowe, R. Hasson, P. J. Rippon, and P. E. D. Strain-Clark. John Milnor found tricorn-like sets as a prototypical configuration in the parameter space of real cubic polynomials, and in various other families of rational maps.

A Douady rabbit is a fractal derived from the Julia set of the function , when parameter is near the center of one of the period three bulbs of the Mandelbrot set for a complex quadratic map.

In mathematics, a Multibrot set is the set of values in the complex plane whose absolute value remains below some finite value throughout iterations by a member of the general monic univariate polynomial family of recursions. The name is a portmanteau of multiple and Mandelbrot set. The same can be applied to the Julia set, this being called Multijulia set.

Fractal-generating software is any type of graphics software that generates images of fractals. There are many fractal generating programs available, both free and commercial. Mobile apps are available to play or tinker with fractals. Some programmers create fractal software for themselves because of the novelty and because of the challenge in understanding the related mathematics. The generation of fractals has led to some very large problems for pure mathematics.
The Mandelbulb is a three-dimensional fractal, constructed for the first time in 1997 by Jules Ruis and in 2009 further developed by Daniel White and Paul Nylander using spherical coordinates.

The Barnsley fern is a fractal named after the British mathematician Michael Barnsley who first described it in his book Fractals Everywhere. He made it to resemble the black spleenwort, Asplenium adiantum-nigrum.

In mathematics, an orbit trap is a method of colouring fractal images based upon how close an iterative function, used to create the fractal, approaches a geometric shape, called a "trap". Typical traps are points, lines, circles, flower shapes and even raster images. Orbit traps are typically used to colour two dimensional fractals representing the complex plane.

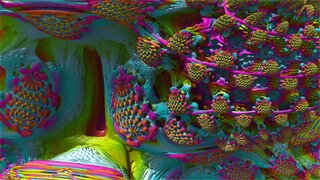
In mathematics, the mandelbox is a fractal with a boxlike shape found by Tom Lowe in 2010. It is defined in a similar way to the famous Mandelbrot set as the values of a parameter such that the origin does not escape to infinity under iteration of certain geometrical transformations. The mandelbox is defined as a map of continuous Julia sets, but, unlike the Mandelbrot set, can be defined in any number of dimensions. It is typically drawn in three dimensions for illustrative purposes.

There are many programs and algorithms used to plot the Mandelbrot set and other fractals, some of which are described in fractal-generating software. These programs use a variety of algorithms to determine the color of individual pixels efficiently.


