In economics, nominal (or, in effect, "named") value refers to value measured in terms of absolute money amounts, whereas real value is considered and measured against the actual goods or services for which it can be exchanged at a given time. For example, if one is offered a salary of $40,000, in that year, the real and nominal values are both $40,000. The following year, any inflation means that although the nominal value remains $40,000, because prices have risen, the salary will buy fewer goods and services, and thus its real value has decreased in accordance with inflation. On the other hand, an asset that holds its value, such as a diamond (making the vastly simplifying assumption of a generally steady market), may increase in nominal price from year to year, but its real value, i.e. its value in relation to other goods and services for which it can be exchanged, or its purchasing power, is consistent over time, because inflation has affected both its nominal value and other goods' nominal values. In spite of changes in the price, it can be sold and an equivalent amount of other gemstones such as emeralds can be purchased, because the emeralds' prices will have increased with inflation as well.
In macroeconomics, the real gross domestic product, or real GDP, compensates for inflation so economists can exclude inflation from growth figures, and see how much the economy actually did grow. Nominal GDP would include inflation, and thus be higher.
Commodity bundles, price indices and inflation
A commodity bundle is a sample of goods, which is used to represent the sum total of goods across the economy to which the goods belong, for the purpose of comparison across different times (or locations).
At a single point of time, a commodity bundle consists of a list of goods, and each good in the list has a market price and a quantity. The market value of the good is the market price times the quantity at that point of time. The nominal value of the commodity bundle at a point of time is the total market value of the commodity bundle, depending on the market price, and the quantity, of each good in the commodity bundle which are current at the time.
A price index is the relative price of a commodity bundle. A price index can be measured over time, or at different locations or markets. If it is measured over time, it is a series of values over time .
A time series price index is calculated relative to a base or reference date. is the value of the index at the base date. For example, if the base date is (the end of) 1992, is the value of the index at (the end of) 1992. The price index is typically normalized to start at 100 at the base date, so is set to 100.
The length of time between each value of and the next one, is normally constant regular time interval, such as a calendar year. is the value of the price index at time after the base date. equals 100 times the value of the commodity bundle at time , divided by the value of the commodity bundle at the base date.
If the price of the commodity bundle has increased by one percent over the first period after the base date, then P1 = 101.
The inflation rate between time and time is the change in the price index divided by the price index value at time :
expressed as a percentage.
Real value
The nominal value of a commodity bundle tends to change over time. In contrast, by definition, the real value of the commodity bundle in aggregate remains the same over time. The real values of individual goods or commodities may rise or fall against each other, in relative terms, but a representative commodity bundle as a whole retains its real value as a constant from one period to the next.
Real values can for example be expressed in constant 1992 dollars, with the price level fixed 100 at the base date.
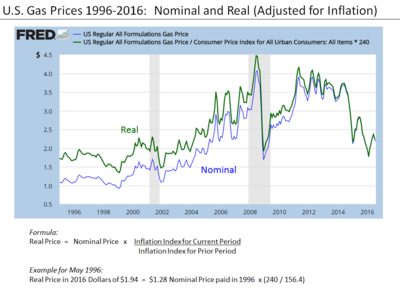
Comparison of real and nominal gas prices 1996 to 2016, illustrating the formula for conversion. Here the base year is 2016.
The price index is applied to adjust the nominal value of a quantity, such as wages or total production, to obtain its real value. The real value is the value expressed in terms of purchasing power in the base year.
The index price divided by its base-year value gives the growth factor of the price index.
Real values can be found by dividing the nominal value by the growth factor of a price index. Using the price index growth factor as a divisor for converting a nominal value into a real value, the real value at time t relative to the base date is:
Real growth rate
The real growth rate is the change in a nominal quantity in real terms since the previous date . It measures by how much the buying power of the quantity has changed over a single period.
where is the nominal growth rate of , and is the inflation rate.
For values of between −1 and 1 (i.e. ±100 percent), we have the Taylor series
so
Hence as a first-order (i.e. linear) approximation,
Real wages and real gross domestic products
The bundle of goods used to measure the Consumer Price Index (CPI) is applicable to consumers. So for wage earners as consumers, an appropriate way to measure real wages (the buying power of wages) is to divide the nominal wage (after-tax) by the growth factor in the CPI.
Gross domestic product (GDP) is a measure of aggregate output. Nominal GDP in a particular period reflects prices that were current at the time, whereas real GDP compensates for inflation. Price indices and the U.S. National Income and Product Accounts are constructed from bundles of commodities and their respective prices. In the case of GDP, a suitable price index is the GDP price index. In the U.S. National Income and Product Accounts, nominal GDP is called GDP in current dollars (that is, in prices current for each designated year), and real GDP is called GDP in [base-year] dollars (that is, in dollars that can purchase the same quantity of commodities as in the base year).
Example
If for years 1 and 2 (possibly a span of 20 years apart), the nominal wage and price level P of goods are respectively
nominal wage rate: $10 in year 1 and $16 in year 2
price level: 1.00 in year 1 and 1.333 in year 2,
then real wages using year 1 as the base year are respectively:
$10 (= $10/1.00) in year 1 and $12 (= $16/1.333) in year 2.
The real wage each year measures the buying power of the hourly wage in common terms. In this example, the real wage rate increased by 20 percent, meaning that an hour's wage would buy 20% more goods in year 2 compared with year 1.
Looking back into the past, the ex post real interest rate is approximately the historical nominal interest rate minus inflation. Looking forward into the future, the expected real interest rate is approximately the nominal interest rate minus the expected inflation rate.
Cross-sectional comparison
Not only time-series data, as above, but also cross-sectional data which depends on prices which may vary geographically for example, can be adjusted in a similar way. For example, the total value of a good produced in a region of a country depends on both the amount and the price. To compare the output of different regions, the nominal output in a region can be adjusted by repricing the goods at common or average prices.
In economics, inflation is a general increase in the prices of goods and services in an economy. This is usually measured using the consumer price index (CPI). When the general price level rises, each unit of currency buys fewer goods and services; consequently, inflation corresponds to a reduction in the purchasing power of money. The opposite of CPI inflation is deflation, a decrease in the general price level of goods and services. The common measure of inflation is the inflation rate, the annualized percentage change in a general price index. As prices faced by households do not all increase at the same rate, the consumer price index (CPI) is often used for this purpose.
In finance and economics, interest is payment from a borrower or deposit-taking financial institution to a lender or depositor of an amount above repayment of the principal sum, at a particular rate. It is distinct from a fee which the borrower may pay to the lender or some third party. It is also distinct from dividend which is paid by a company to its shareholders (owners) from its profit or reserve, but not at a particular rate decided beforehand, rather on a pro rata basis as a share in the reward gained by risk taking entrepreneurs when the revenue earned exceeds the total costs.
A good's price elasticity of demand is a measure of how sensitive the quantity demanded is to its price. When the price rises, quantity demanded falls for almost any good, but it falls more for some than for others. The price elasticity gives the percentage change in quantity demanded when there is a one percent increase in price, holding everything else constant. If the elasticity is −2, that means a one percent price rise leads to a two percent decline in quantity demanded. Other elasticities measure how the quantity demanded changes with other variables.
In economics, the GDP deflator is a measure of the money price of all new, domestically produced, final goods and services in an economy in a year relative to the real value of them. It can be used as a measure of the value of money. GDP stands for gross domestic product, the total monetary value of all final goods and services produced within the territory of a country over a particular period of time.
Real gross domestic product is a macroeconomic measure of the value of economic output adjusted for price changes. This adjustment transforms the money-value measure, nominal GDP, into an index for quantity of total output. Although GDP is total output, it is primarily useful because it closely approximates the total spending: the sum of consumer spending, investment made by industry, excess of exports over imports, and government spending. Due to inflation, GDP increases and does not actually reflect the true growth in an economy. That is why the GDP must be divided by the inflation rate to get the growth of the real GDP. Different organizations use different types of 'Real GDP' measures, for example, the UNCTAD uses 2015 Constant prices and exchange rates while the FRED uses 2009 constant prices and exchange rates, and recently the World Bank switched from 2005 to 2010 constant prices and exchange rates.
The quantity theory of money is a theory from monetary economics which states that the general price level of goods and services is directly proportional to the amount of money in circulation, and that the causality runs from money to prices. This implies that the theory potentially explains inflation. It originated in the 16th century and has been proclaimed the oldest surviving theory in economics.
In microeconomics, a consumer's Marshallian demand function is the quantity they demand of a particular good as a function of its price, their income, and the prices of other goods, a more technical exposition of the standard demand function. It is a solution to the utility maximization problem of how the consumer can maximize their utility for given income and prices. A synonymous term is uncompensated demand function, because when the price rises the consumer is not compensated with higher nominal income for the fall in their real income, unlike in the Hicksian demand function. Thus the change in quantity demanded is a combination of a substitution effect and a wealth effect. Although Marshallian demand is in the context of partial equilibrium theory, it is sometimes called Walrasian demand as used in general equilibrium theory.
A price index is a normalized average of price relatives for a given class of goods or services in a given region, during a given interval of time. It is a statistic designed to help to compare how these price relatives, taken as a whole, differ between time periods or geographical locations.
The velocity of money measures the number of times that one unit of currency is used to purchase goods and services within a given time period. The concept relates the size of economic activity to a given money supply, and the speed of money exchange is one of the variables that determine inflation. The measure of the velocity of money is usually the ratio of the gross national product (GNP) to a country's money supply.
The general price level is a hypothetical measure of overall prices for some set of goods and services, in an economy or monetary union during a given interval, normalized relative to some base set. Typically, the general price level is approximated with a daily price index, normally the Daily CPI. The general price level can change more than once per day during hyperinflation.
Return rate is a corporate finance and accounting tool which calculates the gain and loss of investment over a certain period of time.
In monetary economics, the equation of exchange is the relation:
The United States Consumer Price Index (CPI) is a set of various consumer price indices published monthly by the U.S. Bureau of Labor Statistics (BLS). The most commonly used are the CPI-U and the CPI-W, though many alternative versions exist. The CPI-U is the most popular measure of consumer inflation in the United States.
Competitive equilibrium is a concept of economic equilibrium, introduced by Kenneth Arrow and Gérard Debreu in 1951, appropriate for the analysis of commodity markets with flexible prices and many traders, and serving as the benchmark of efficiency in economic analysis. It relies crucially on the assumption of a competitive environment where each trader decides upon a quantity that is so small compared to the total quantity traded in the market that their individual transactions have no influence on the prices. Competitive markets are an ideal standard by which other market structures are evaluated.
The international dollar, also known as Geary–Khamis dollar, is a hypothetical unit of currency that has the same purchasing power parity that the U.S. dollar had in the United States at a given point in time. It is mainly used in economics and financial statistics for various purposes, most notably to determine and compare the purchasing power parity and gross domestic product of various countries and markets. The year 1990 or 2000 is often used as a benchmark year for comparisons that run through time. The unit is often abbreviated, e.g. 2000 US dollars or 2000 International$.
Earnings growth is the annual compound annual growth rate (CAGR) of earnings from investments.
In monetary policy, the McCallum rule specifies a target for the monetary base (M0) which could be used by a central bank. The McCallum rule was proposed by Bennett T. McCallum at Carnegie Mellon University's Tepper School of Business. It is an alternative to the well known Taylor rule and performs better during crisis periods.
Relative Purchasing Power Parity is an economic theory which predicts a relationship between the inflation rates of two countries over a specified period and the movement in the exchange rate between their two currencies over the same period. It is a dynamic version of the absolute purchasing power parity theory.
A nominal income target is a monetary policy target. Such targets are adopted by central banks to manage national economic activity. Nominal aggregates are not adjusted for inflation. Nominal income aggregates that can serve as targets include nominal gross domestic product (NGDP) and nominal gross domestic income (GDI). Central banks use a variety of techniques to hit their targets, including conventional tools such as interest rate targeting or open market operations, unconventional tools such as quantitative easing or interest rates on excess reserves and expectations management to hit its target. The concept of NGDP targeting was formally proposed by neo-Keynesian economists James Meade in 1977 and James Tobin in 1980, although Austrian School economist Friedrich Hayek argued in favor of the stabilization of nominal income as a monetary policy norm as early as 1931 and as late as 1975.
O'Donnell, R. (1987). "Real and Nominal Quantities". The New Palgrave: A Dictionary of Economics. Vol.v. 4. pp.97–98. (Adam Smith's early distinction vindicated)
This page is based on this Wikipedia article Text is available under the CC BY-SA 4.0 license; additional terms may apply. Images, videos and audio are available under their respective licenses.