Renewable energy industry

Last updated

The renewable-energy industry is the part of the energy industry focusing on new and appropriate renewable energy technologies. Investors worldwide have paid greater attention to this emerging industry in recent years. In many cases, this has translated into rapid renewable energy commercialization and considerable industry expansion. The wind power, solar power and hydroelectric power industries provide good examples of this.

Contents

Global renewable energy investment growth (1995-2007) Re investment 1995-2007.jpg
Global renewable energy investment growth (1995-2007)

In 2020, the global renewable energy market was valued at $881.7 billion [2] and consumption grew 2.9 EJ. [3] China was the largest contributor to renewable growth, accounting an increment of 1.0 EJ in consumption, followed by the US, Japan, the United Kingdom, India, and Germany. In Europe, renewable consumption incremented 0.7 EJ. [3]

Renewable energy power growth in GW (2004-2011) GlobalREPowerCapacity-exHydro-Eng.png
Renewable energy power growth in GW (2004-2011)

Overview

Net-zero and 100% renewable energy global goals create market opportunities for renewable industries such as solar and wind energy and lithium-ion batteries. By 2050, it’s estimated that the renewable market will reach a value of one trillion dollars, the same size as the current oil market. [4]

In 2020, renewable sources incorporated into energy consumption at its fastest rate in two decades. [4]

During 2006/2007, several renewable energy companies went through high profile initial public offerings (IPOs), resulting in market capitalization near or above $1 billion. These corporations included the solar PV companies First Solar (USA), Trina Solar (USA), Centrosolar (Germany), and Renesola (U.K.), wind power company Iberdrola (Spain), and U.S. biofuels producers VeraSun Energy, Aventine, and Pacific Ethanol. [1]

Renewable energy industries expanded during most of 2008, with large increases in manufacturing capacity, diversification of manufacturing locations, and shifts in leadership. [5] By August 2008, there were at least 160 publicly traded renewable energy companies with a market capitalization greater than $100 million. The number of companies in this category has expanded from around 60 in 2005. [6] :15

Some $150 billion was invested in renewable energy globally in 2009, including new capacity (asset finance and projects) and biofuels refineries. This is more than double the 2006 investment figure of $63 billion. Almost all of the increase was due to greater investment in wind power, solar PV, and biofuels. [7] :27

In 2000, venture capital (VC) investment in renewable energy was about 1% of total VC investment. In 2007 that figure was closer to 10%, with solar power alone making up about 3% of the entire Venture Capital asset class of ~$33B. More than 60 start-ups have been funded by VCs in the last three years. [8] Venture capital and private equity investments in renewable energy companies increased by 167 percent in 2006, according to investment analysts at New Energy Finance Limited. [9]

New investment into the sector jumped US$148 billion in 2007, up 60 per cent over 2006, noted a report by the Sustainable Energy Finance Initiative (SEFI). Wind energy attracted one-third of the new capital and solar one-fifth. But interest in solar is growing rapidly on the back of major technological advances which saw solar investment increase 254 per cent. [10] The IEA predicts US$20 trillion will be invested into alternative energy projects over the next 22 years. [10]

Selected renewable energy indicators [7] :13 [11]
Selected global indicators20062007200820092010
Investment in new renewable capacity (annual)63104130150243 billion USD
Existing renewables power capacity,
excluding large hydro
207210250305 ? GW
Wind power capacity (existing)7494121159 ? GW
Solar (PV) power capacity (grid connected)5.17.51321 ? GW
Ethanol production (annual)39536976 ? billion liters

Wind power

In 2020, wind power accounted for more than six percent of global electricity with 743 GW of global capacity. [12] [13] In the same year, 93 GW capacity was installed. For reach a 'net zero' emission status, the world needs to install at least 180 GW of new wind energy capacity by year. [13]

Companies

Vestas was the largest wind turbine manufacturer in the world with and 16% market share in 2020. [14] The company operates plants in Denmark, Germany, India, Italy, Britain, Spain, Sweden, Norway, Australia and China, [15] and employs more than 20,000 people globally. [16] After a sales slump in 2005, Vestas recovered and was voted Top Green Company of 2006. [17] [18]

In 2020, Siemens Gamesa was the world's second largest wind turbine manufacturer in 2020 thank to its position in the offshore sector of India. The company lead the offshore wind market. [19]

Other major wind power companies include GE Power, Suzlon, Sinovel and Goldwind. [14] [20]

Wind potential

Africa's onshore wind energy potential is calculated of almost 180,000 Terawatt hours (TWh) per annum, which is able to satisfy the electricity demands of the continent 250 times over. [21] In 2009, a technical study by the Wind Energy Technologies Office estimated that the onshore wind energy potential for the United States is 10,500 gigawatt (GW) capacity at 80 meters. [22]

Photovoltaics

Solar production has been increasing by an average of some 20 percent each year since 2002, making it the world’s fastest-growing energy technology. [23] [24] At the end of 2009, the cumulative global PV installations surpassed 21,000 megawatts. [24] [6] :12

According to the China Greentech Report 2009, jointly issued by the PricewaterhouseCoopers and American Chamber of Commerce in Shanghai and released on 10 Sept in Dalian, China, the estimated size of China's green technology market could be between US$500 billion and US$1 trillion annually, or as much as 15 percent of China's forecasted GDP, in 2013. With the positive drivers from the Chinese government’s policies to develop green technology solution, China has already played a more important role in green technology market development. [25] Following the announcements of the Chinese government in 2009 about the new subsidy scheme of “Golden Sun” to support solar industry development in China, some of the worldwide industry players have announced their development plans in this region, such as the agreement signed by LDK Solar regarding a solar project in Jiangsu province with a total capacity of 500MW, [26] manufacturing facilities of polysilicon ingots and wafers, PV cells and PV modules to be built by Yingli Green Energy in Hainan Province, [27] and the new thin film manufacturing plants of Tianwei Baoding [28] and Anwell Technologies. [29] In 2022, solar power market is expected to reach a value of $422 billion. [30]

Companies

Monocrystalline solar cell Klassieren.jpg
Monocrystalline solar cell

In 2017, main manufacturers of photovoltaics cells are based in Asia. Nine out of twelve major companies are based in China. The manufacturer Jinko Solar was the leader company in the sector, with 9.86% of the market share, followed by Trina Solar, JA Solar, Canadian Solar and Hanwha Q-Cells. [31]

Tengger Desert Solar Park is the largest solar park in the world, with a capacity of 1,547MW. The park is located in Zhongwei, Ningxia, and it's called the Great Wall of Solar. [32]

Biofuels

Brazil continued its ethanol expansion plans which began in the 70's and now has the largest ethanol distribution and the largest fleet of cars run by any mix of ethanol and gasoline. [1] :19

Information on pump, California EthanolPetrol.jpg
Information on pump, California

In the ethanol fuel industry, the United States dominated, with 130 operating ethanol plants in 2007, and production capacity of 26 billion liters/year (6.87 billion gallons/year), a 60 percent increase over 2005. Another 84 plants were under construction or undergoing expansion, and this will result in a doubled production capacity. The biodiesel industry opened many new production facilities during 2006/2007 and continued expansion plans in several countries. New biodiesel capacity appeared throughout Europe, including in Belgium, Czech Republic, France, Germany, Italy, Poland, Portugal, Spain, Sweden, and the United Kingdom. [1] :19

Commercial investment in second-generation biofuels began in 2006/2007, and much of this investment went beyond pilot-scale plants. The world’s first commercial wood-to-ethanol plant began operation in Japan in 2007, with a capacity of 1.4 million liters/year. The first wood-to-ethanol plant in the United States is planned for 2008 with an initial output of 75 million liters/year. [1] :19

Employment

Renewable energy use tends to be more labor-intensive than fossil fuels, and so a transition toward renewables promises employment gains. In 2019, 11.5 million people work either directly in renewables or indirectly in supplier industries. [33] The wind power industry employs some 1.7 million people, the photovoltaic sector accounts for an estimated 3.7 million jobs, and the solar thermal industry accounts for about 820,000. More than 3.58 million jobs are located in the biomass and biofuels sector. [33]

See also

Related Research Articles

<span class="mw-page-title-main">Renewable energy</span> Energy collected from renewable resources

Renewable energy is energy from renewable resources that are naturally replenished on a human timescale. Renewable resources include sunlight, wind, the movement of water, and geothermal heat. Although most renewable energy sources are sustainable, some are not. For example, some biomass sources are considered unsustainable at current rates of exploitation. Renewable energy is often used for electricity generation, heating and cooling. Renewable energy projects are typically large-scale, but they are also suited to rural and remote areas and developing countries, where energy is often crucial in human development.

<span class="mw-page-title-main">Energy development</span> Methods bringing energy into production

Energy development is the field of activities focused on obtaining sources of energy from natural resources. These activities include the production of renewable, nuclear, and fossil fuel derived sources of energy, and for the recovery and reuse of energy that would otherwise be wasted. Energy conservation and efficiency measures reduce the demand for energy development, and can have benefits to society with improvements to environmental issues.

<span class="mw-page-title-main">Renewable energy in the European Union</span>

Renewable energy plays an important and growing role in the energy system of the European Union. The Europe 2020 strategy included a target of reaching 20% of gross final energy consumption from renewable sources by 2020, and at least 32% by 2030. The EU27 reached 22% in 2020 and 23% in 2022, up from 9.6% in 2004. These figures are based on energy use in all its forms across all three main sectors, the heating and cooling sector, the electricity sector, and the transport sector.

<span class="mw-page-title-main">Clean technology</span> Any process, product, or service that reduces negative environmental impacts

Clean technology, in short cleantech or climatetech, is any process, product, or service that reduces negative environmental impacts through significant energy efficiency improvements, the sustainable use of resources, or environmental protection activities. Clean technology includes a broad range of technology related to recycling, renewable energy, information technology, green transportation, electric motors, green chemistry, lighting, grey water, and more. Environmental finance is a method by which new clean technology projects can obtain financing through the generation of carbon credits. A project that is developed with concern for climate change mitigation is also known as a carbon project.

Renewable Fuels are fuels produced from renewable resources. Examples include: biofuels, Hydrogen fuel, and fully synthetic fuel produced from ambient carbon dioxide and water. This is in contrast to non-renewable fuels such as natural gas, LPG (propane), petroleum and other fossil fuels and nuclear energy. Renewable fuels can include fuels that are synthesized from renewable energy sources, such as wind and solar. Renewable fuels have gained in popularity due to their sustainability, low contributions to the carbon cycle, and in some cases lower amounts of greenhouse gases. The geo-political ramifications of these fuels are also of interest, particularly to industrialized economies which desire independence from Middle Eastern oil.

<span class="mw-page-title-main">Renewable energy in Australia</span>

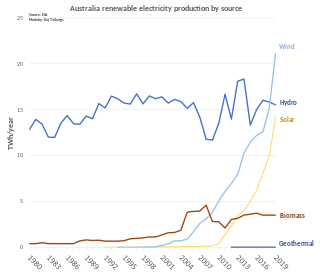
Renewable energy in Australia includes wind power, hydroelectricity, solar photovoltaics, heat pumps, geothermal, wave and solar thermal energy.

<span class="mw-page-title-main">Renewable energy commercialization</span> Deployment of technologies harnessing easily replenished natural resources

Renewable energy commercialization involves the deployment of three generations of renewable energy technologies dating back more than 100 years. First-generation technologies, which are already mature and economically competitive, include biomass, hydroelectricity, geothermal power and heat. Second-generation technologies are market-ready and are being deployed at the present time; they include solar heating, photovoltaics, wind power, solar thermal power stations, and modern forms of bioenergy. Third-generation technologies require continued R&D efforts in order to make large contributions on a global scale and include advanced biomass gasification, hot-dry-rock geothermal power, and ocean energy. In 2019, nearly 75% of new installed electricity generation capacity used renewable energy and the International Energy Agency (IEA) has predicted that by 2025, renewable capacity will meet 35% of global power generation.

<span class="mw-page-title-main">China Village Electrification Program</span>

The China Village Electrification Program was a scheme to provide renewable electricity to 3.5 million households in 10,000 villages by 2010. This was to be followed by full rural electrification using renewable energy by 2015.

For solar power, South Asia has the ideal combination of both high solar insolation and a high density of potential customers.

<span class="mw-page-title-main">Renewable energy in the United States</span>

According to data from the US Energy Information Administration, renewable energy accounted for 8.4% of total primary energy production and 21% of total utility-scale electricity generation in the United States in 2022.

<span class="mw-page-title-main">Energy policy of China</span> Energy sources used and produced by China

China is both the world's largest energy consumer and the largest industrial country, and ensuring adequate energy supply to sustain economic growth has been a core concern of the Chinese Government since the founding of the People's Republic of China in 1949. Since the country's industrialization in the 1960s, China is currently the world's largest emitter of greenhouse gases, and coal in China is a major cause of global warming. However, from 2010 to 2015 China reduced energy consumption per unit of GDP by 18%, and CO2 emissions per unit of GDP by 20%. On a per-capita basis, China was only the world's 51st largest emitter of greenhouse gases in 2016. China is also the world's largest renewable energy producer, and the largest producer of hydroelectricity, solar power and wind power in the world. The energy policy of China is connected to its industrial policy, where the goals of China's industrial production dictate its energy demand managements.  

<span class="mw-page-title-main">Renewable energy in Finland</span> Overview of renewable energy in Finland

Renewable energy in Finland grew to 38.7% of total final energy consumption by year end 2014, achieving joint second position with Latvia in terms of renewable energy consumption by share amongst the EU-28 countries, behind its neighbour Sweden in first position on a 52.6% share. The 2014 share in Finland breaks down as renewable energy providing 52% of the heating and cooling sector, 31.4% of the electricity sector and 21.6% of the transport sector. By 2014, Finland had already exceeded its 2020 target for renewable energy use under the EU renewable energy directive as shown in the table of country targets.

<span class="mw-page-title-main">Clean Energy Trends</span> Energy development

Clean Energy Trends is a series of reports by Clean Edge which examine markets for solar, wind, geothermal, fuel cells, biofuels, and other clean energy technologies. Since the publication of the first Clean Energy Trends report in 2002, Clean Edge has provided an annual snapshot of both the global and U.S. clean energy sector markets.

<span class="mw-page-title-main">Renewable energy in China</span>

China is the world's leader in electricity production from renewable energy sources, with over triple the generation of the second-ranking country, the United States. China's renewable energy sector is growing faster than its fossil fuels and nuclear power capacity, and is expected to contribute 43 per cent of global renewable capacity growth. China's total renewable energy capacity exceeded 1,000 GW in 2021, accounting for 43.5 per cent of the country's total power generation capacity, 10.2 percentage points higher than in 2015. The country aims to have 80 per cent of its total energy mix come from non-fossil fuel sources by 2060, and achieve a combined 1,200 GW of solar and wind capacity by 2030. In 2023, it was reported that China was on track to reach 1,371 gigawatts of wind and solar by 2025, five years ahead of target due to new renewables installations breaking records.

<span class="mw-page-title-main">Renewable energy in developing countries</span> Overview of the use of renewable energy in several developing countries

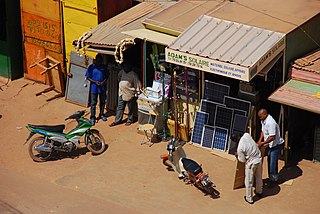
Renewable energy in developing countries is an increasingly used alternative to fossil fuel energy, as these countries scale up their energy supplies and address energy poverty. Renewable energy technology was once seen as unaffordable for developing countries. However, since 2015, investment in non-hydro renewable energy has been higher in developing countries than in developed countries, and comprised 54% of global renewable energy investment in 2019. The International Energy Agency forecasts that renewable energy will provide the majority of energy supply growth through 2030 in Africa and Central and South America, and 42% of supply growth in China.

<span class="mw-page-title-main">Renewable energy in Canada</span> Use of renewable resources in Canada

As of 2019, renewable energy technologies provide about 17.3% of Canada's total primary energy supply. For electricity renewables provide 67%, with 15% from nuclear and 18% from hydrocarbons.

<span class="mw-page-title-main">Renewable energy debate</span>

Policy makers often debate the constraints and opportunities of renewable energy.

Renewable energy in Greece accounted for 29 percent of its electricity from renewable sources in 2021. By 2030, renewables are expected to have a capacity of 28GW, and exceed 61 percent of Greece's electricity consumption. This is a significant increase from 8% of the country's total energy consumption in 2008. By 2022, Greece occasionally reached 100% renewables for a few hours. The target for 2050 is a capacity of 65GW.

References

  1. 1 2 3 4 5 Renewables 2007 Global Status Report (PDF). REN21. 2008.
  2. "Renewable Energy Market Size, Share Analysis | Growth Forecast - 2030". Allied Market Research. Retrieved 2021-10-13.
  3. 1 2 "Renewable energy | Energy economics | Home". bp global. Retrieved 2021-10-14.
  4. 1 2 "World Energy Outlook 2021 shows a new energy economy is emerging – but not yet quickly enough to reach net zero by 2050 - News". IEA. Retrieved 2021-10-14.
  5. BTM Forecasts 340-GW of Wind Energy by 2013
  6. 1 2 Renewables Global Status Report: 2009 Update. REN21. 2009.
  7. 1 2 Renewables Global Status Report: 2010. REN21. 2010.
  8. "Archived copy" (PDF). Archived from the original (PDF) on 2009-04-19. Retrieved 2009-07-06.{{cite web}}: CS1 maint: archived copy as title (link)
  9. EERE News: Clean Energy Investments More Than Double in 2006
  10. 1 2 Financial Standard - Energy investments surge
  11. "2010 Clean Energy Investment Hits a New Record". Renewable Energy World . 2011-01-20. Retrieved 2018-01-05.
  12. "Renewable Energy". Center for Climate and Energy Solutions. 2021-10-27. Retrieved 2022-01-15.
  13. 1 2 "Wind power capacity needs to grow at thrice the current speed to reach net zero: Report". www.downtoearth.org.in. Retrieved 2022-01-15.
  14. 1 2 "Top 10 Wind Turbine Manufacturers in the World 2020 - BizVibe". Bizvibe Blog. 2020-05-26. Retrieved 2021-10-14.
  15. Profits soar for top wind turbine maker
  16. "Profile - History". Vestas. 2012-03-11. Retrieved 2018-01-05.
  17. Portfolio 21: Vestas Wind Systems Top Green Company of 2006
  18. "Toyota, Tesla and Vestas ranked among world's top green companies". the Guardian. 2016-08-15. Retrieved 2018-01-05.
  19. "Top 10 Wind Turbine Manufacturers in the World 2020 - BizVibe". Bizvibe Blog. 2020-05-26. Retrieved 2021-10-14.
  20. Keith Johnson, Wind Shear: GE Wins, Vestas Loses in Wind-Power Market Race, Wall Street Journal, March 25th 2009, accessed on January 7th 2010.
  21. "New Analysis Shows Onshore Wind Potential Across Africa Enough to Power the Entire Continent Many Times Over". pressroom.ifc.org. Retrieved 2022-01-15.
  22. "Wind Resource Assessment and Characterization". Energy.gov. Retrieved 2022-01-15.
  23. Solar Expected to Maintain its Status as the World's Fastest-Growing Energy Technology
  24. 1 2 James Russell. Record Growth in Photovoltaic Capacity and Momentum Builds for Concentrating Solar Power Vital Signs, June 03, 2010.
  25. "China's green technology market to attract huge investment". People’s Daily online. 2009-09-11.
  26. "LDK Solar Signs 500MW PV Projects Agreement". Solarbuzz. August 26, 2009.
  27. "Yingli Green Energy Expands Its Footprint in the China Market". Solarbuzz. July 22, 2009.
  28. "Baoding Tianwei Starts Mass Production of Thin Film Solar Panels". Solarbuzz. August 27, 2009.
  29. "Anwell Produces its First Thin Film Solar Panel". Solarbuzz. September 7, 2009.
  30. "Solar power market value globally 2022". Statista. Retrieved 2022-02-28.
  31. "Market distribution of photovoltaic module manufacturers 2017". Statista. Retrieved 2022-02-28.
  32. "The world's biggest solar power plants". Power Technology. 2020-01-10. Retrieved 2022-02-28.
  33. 1 2 "Renewable Energy and Jobs – Annual Review 2020". International Renewable Energy Agency. September 2020. Retrieved 2021-10-13.

Bibliography

PD-icon.svg This article incorporates public domain material from the United States Government