2006 BCS computer rankings

Last updated

In American college football, the 2006 BCS computer rankings are a part of the Bowl Championship Series (BCS) formula that determines who plays in the BCS National Championship Game as well as several other bowl games. Each computer system was developed using different methods which attempts to rank the teams' performance. For 2006, the highest and lowest rankings for a team are dropped and the remaining four rankings are summed. A team ranked #1 by a computer system is given 25 points, #2 is given 24 points and so forth. The summed values are then divided by 100 (the maximum value a team can earn if they received four first place votes that were summed). The values are then ranked by percentage. This percentage ranking is then averaged with the Coaches Poll and Harris Poll average rankings, each receiving equal weight, and the results become the BCS Rankings.

Contents

BCS computer rankings average

For 2006, the rankings were released beginning with the eighth week of the season on October 14. Data taken from official BCS website. There are missing values in the table because the BCS Rankings only list the top 25 of the BCS Rankings, providing data on how those teams achieved their top 25 ranking. The computers ranking may include teams that do not make the top 25 BCS Rankings once averaged with the AP and Coaches Polls.

Week 8
Oct 14
Week 9
Oct 21
Week 10
Oct 28
Week 11
Nov 4
Week 12
Nov 11
Week 13
Nov 18
Week 14
Nov 25
Week 15
Dec 3
1.USC (5)USC (3) тMichigan (5)Michigan (5)Michigan (5)Ohio State (6)Ohio State (5)Ohio State (5)1.
2.MichiganMichigan (2) тOhio State (1)Ohio State (1)RutgersMichiganUSC (1)Florida (1) т2.
3.Ohio State (1)Ohio State (1)CaliforniaLouisvilleOhio State (1)USCMichiganMichigan т3.
4.FloridaFloridaFloridaCaliforniaUSCFloridaFloridaUSC4.
5.AuburnCaliforniaNotre DameFloridaNotre DameNotre DameLSULSU5.
6.CaliforniaAuburnUSCNotre DameFloridaLouisvilleLouisvilleLouisville6.
7.Notre DameRutgersAuburnUSCLouisvilleArkansasBoise StateBoise State7.
8.ArkansasNotre DameRutgersAuburnWisconsinWisconsinNotre DameAuburn8.
9.RutgersLouisvilleLouisvilleRutgersArkansasWest VirginiaArkansasNotre Dame9.
10.LouisvilleArkansasTennesseeTexasBoise StateRutgersAuburnWisconsin10.
11.Boise StateTennesseeBoise StateWisconsinWest VirginiaLSURutgersCalifornia11.
12.TennesseeBoise StateTexasBoise StateCaliforniaBoise StateWisconsinArkansas12.
13.OregonTexasWest VirginiaArkansasLSUAuburnTennessee тTennessee13.
14.West VirginiaWest VirginiaArkansasWest VirginiaAuburnCaliforniaCalifornia тWest Virginia т14.
15.TexasClemsonWisconsinLSUGeorgia TechTexasOklahomaRutgers т15.
16.ClemsonBoston College тBoston CollegeTennesseeTexasGeorgia TechVirginia TechOklahoma16.
17.WisconsinWashington StateOklahomaWake ForestVirginia TechWest VirginiaOregon State17.
18.Boston CollegeWashington StateGeorgia TechGeorgia TechTennesseeTennesseeWake ForestWake Forest18.
19.NebraskaMissouriOregonOregonOklahomaBoston CollegeOregon StateVirginia Tech19.
20.TulsaLSUClemsonWake ForestMarylandOklahomaUCLA20.
21.LSUTexas A&M тOklahomaOregon StateBoston CollegePenn StateTexasTexas т21.
22.Georgia TechOregon тBoston CollegeOregonWake ForestBYU22.
Week 8
Oct 14
Week 9
Oct 21
Week 10
Oct 28
Week 11
Nov 4
Week 12
Nov 11
Week 13
Nov 18
Week 14
Nov 25
Week 15
Dec 3
Dropped:
  • Clemson
  • Wisconsin
  • Nebraska
  • Tulsa
  • Georgia Tech
Dropped:
Missouri
Dropped:
  • Washington State
  • Clemson
  • Texas A&M
Dropped:
Oregon State
Dropped:
  • Maryland
  • Oregon
Dropped:
  • Georgia Tech
  • Boston College
  • Penn State
  • Clemson
Dropped:
Nebraska

Anderson & Hester

Jeff Anderson and Chris Hester are the owners of this computer system that has been a part of the BCS since its inception. The Anderson & Hester Rankings claim to be distinct in four ways: [1]

  1. These rankings do not reward teams for running up scores. Teams are rewarded for beating quality opponents, which is the object of the game. Margin of victory, which is not the object of the game, is not considered.
  2. Unlike the AP and Coaches Polls, these rankings do not prejudge teams. These rankings first appear after the season's fifth week, and each team's ranking reflects its actual accomplishments on the field, not its perceived potential.
  3. These rankings compute the most accurate strength of schedule ratings. Each team's opponents and opponents' opponents are judged not only by their won-lost records but also, uniquely, by their conferences' strength (see #4).
  4. These rankings provide the most accurate conference ratings. Each conference is rated according to its non-conference won-lost record and the difficulty of its non-conference schedule.

The margin of victory was once allowed by the BCS for the computers, but was removed following the 2004 season. Therefore, all six computer systems do not include margin of victory. However, this computer system has never included it in its formula. In addition, only human polls (specifically the AP Poll and Coaches Poll in this reference) "prejudge" teams by releasing pre-season polls with the expected rankings of teams before they have played any games. The last two claims are subjective opinions by the authors of this computer system.

Week 8
Oct 14
Week 9
Oct 21
Week 10
Oct 28
Week 11
Nov 4
Week 12
Nov 11
Week 13
Nov 18
Week 14
Nov 25
Week 15
Dec 3
1.USC (6-0)USC (6-0)Michigan(9-0)Michigan (10-0)Michigan (11-0)Ohio State (12-0)Ohio State (12-0)Ohio State (12-0)1.
2.Michigan (7-0)Michigan (8-0)Ohio State (9-0)Ohio State (10-0)Ohio State (11-0)Michigan (11-1)USC (10-1)Florida (12-1)2.
3.Ohio State (7-0)Ohio State (8-0)Rutgers (7-0)Louisville (8-0)Rutgers (9-0)USC (9-1)Michigan (11-1)Michigan (11-1)3.
4.Florida (6-1)Rutgers (7-0)Louisville (7-0)Florida (8-1)Florida (9-1)Florida (10-1)Florida (11-1)LSU (10-2)4.
5.Rutgers (6-0)Florida (6-1)USC (6-1)California (8-1)USC (8-1)Arkansas (10-1)LSU (10-2)Louisville (11-1)5.
6.Louisville (6-0)Louisville (7-0)Florida (7-1)USC (7-1)Notre Dame (9-1)Louisville (9-1)Louisville (10-1)USC (10-2)6.
7.Auburn (6-1)California (7-1)California (7-1)Rutgers (8-0)Louisville (8-1)Notre Dame (10-1)Rutgers (10-1)Boise State (12-0)7.
8.Notre Dame (5-1)Notre Dame (6-1)Notre Dame (7-1)Notre Dame (8-1)Arkansas (9-1)West Virginia (9-1)Boise State (12-0)Notre Dame (10-2)8.
9.California (6-1)Auburn (7-1)Auburn (8-1)Auburn (9-1)Wisconsin (10-1)Rutgers (9-1)Notre Dame (10-2)Auburn (10-2)9.
10.Arkansas (5-1)Tennessee (6-1)Tennessee (7-1)Texas (9-1)West Virginia (8-1)LSU (9-2)Auburn (10-2)Rutgers (10-2)10.
11.Boise State (6-0)West Virginia (7-0)West Virginia (7-0)Boise State (9-0)Boise State (10-0)Auburn (10-2)Arkansas (10-2)Oklahoma (11-2)11.
12.Tennessee (5-1)Boise State (8-0)Boise State (8-0)Tennessee (7-2)California (8-2)Boise State (11-0)Tennessee (9-3)West Virginia (10-2)12.
13.West Virginia (6-0)Arkansas (6-1)Texas (8-1)West Virginia (7-1)Auburn (9-2)Wisconsin (11-1)California (8-3)Tennessee (9-3)13.
14.Oregon (5-1)Boston College (6-1)Arkansas (7-1)Arkansas (8-1)LSU (8-2)California (8-3)Wisconsin (11-1)California (9-3)14.
15.Boston College (5-1)Clemson (7-1)Boston College (7-1)LSU (7-2)Wake Forest (9-1)Oklahoma (9-2)Oklahoma (10-2)Wisconsin (11-1)15.
16.Clemson (6-1)Texas (7-1)Texas A&M (8-1)Wisconsin (9-1)Texas (9-2)Tennessee (8-3)West Virginia (9-2)Arkansas (10-3)16.
17.Texas (6-1)Missouri (7-1)Wisconsin (8-1)Oklahoma (7-2)Oklahoma (8-2)Texas (9-2)Virginia Tech (10-2)Wake Forest (11-2)17.
18.Nebraska (6-1)Wisconsin (7-1)Washington State (6-3)Wake Forest (8-1)Tennessee (7-3)Virginia Tech (9-2)Wake Forest (10-2)Virginia Tech (10-2)18.
19.LSU (5-2)Texas A&M (7-1)LSU (6-2)Georgia Tech (7-2)Georgia Tech (8-2)Boston College (9-2)Texas (9-3)Oregon State (9-4)19.
20.Texas A&M (6-1)Washington State (5-3)Clemson (7-2)Oregon (7-2)Maryland (8-2)Georgia Tech (9-2)Oregon State (8-4)Texas (9-3)20.
21.Wake Forest (6-1)LSU (6-2)Georgia Tech (6-2)Oregon State (6-3)Boston College (8-2)Wake Forest (8-3)Nebraska (9-3)UCLA (7-5)21.
22.Georgia Tech (5-1)Wake Forest (6-1)Oklahoma (6-2)Boston College (7-2)Oregon (7-3)Clemson (8-3)BYU (10-2)BYU (10-2)22.
23.Missouri (6-1)Oregon (5-2)Wake Forest (7-1)Virginia Tech (7-2)Virginia Tech (8-2)Nebraska (8-3)Texas A&M (9-3)Texas A&M (9-3)23.
24.Wisconsin (6-1)Tulsa (6-1)Missouri (7-2)Maryland (7-2)Nebraska (8-3)Penn State (8-4)Georgia Tech (9-3)Georgia (8-4)24.
25.Tulsa (5-1)Georgia Tech (5-2)Oregon (6-2)Texas A&M (8-2)Clemson (8-3)BYU (9-2)Georgia (8-4)Boston College (9-3)25.
Week 8
Oct 14
Week 9
Oct 21
Week 10
Oct 28
Week 11
Nov 4
Week 12
Nov 11
Week 13
Nov 18
Week 14
Nov 25
Week 15
Dec 3
Dropped:
Nebraska
Dropped:
Tulsa
Dropped:
  • Washington State
  • Clemson
  • Missouri
Dropped:
  • Oregon State
  • Texas A&M
Dropped:
  • Maryland
  • Oregon
Dropped:
  • Boston College
  • Clemson
  • Penn State
Dropped:
  • Nebraska
  • Georgia Tech

Billingsley

Richard Billingsley is the owner of this computer system. Self-described as not a mathematician or computer-geek; simply a devout college football fan since the age of 7. [2] The main components in the formula are: Won-Loss Records, Opponent Strength (based on the opponent's record, rating, and rank), with a strong emphasis on the most recent performance. Very minor consideration is also given to the site of the game, and defensive scoring performance.

Billingsley did use margin of victory, but removed it after the 2001 season. It had accounted for 5% of the total ranking for his system and was part of the system for 32 years. Also, this computer system releases rankings each week, using a complex formula to incorporate the previous season's rank (but not ranking score) into the early parts of the current season.

For the 2006 season, this computer ranking uniquely favored Penn State and TCU.

Week 8
Oct 14
Week 9
Oct 21
Week 10
Oct 28
Week 11
Nov 4
Week 12
Nov 11
Week 13
Nov 18
Week 14
Nov 25
Week 15
Dec 3
1.Ohio State (7-0)Ohio State (8-0)Ohio State (9-0)Ohio State (10-0)Ohio State (11-0)Ohio State (12-0)Ohio State (12-0)Ohio State (12-0)1.
2.USC (6-0)Michigan (8-0)Michigan (9-0)Michigan (10-0)Michigan (11-0)Michigan (11-1)Michigan (11-1)Michigan (11-1)2.
3.Michigan (7-0)USC (6-0)Texas (8-1)Texas (9-1)Rutgers (9-0)USC (9-1)USC (10-1)Florida (12-1)3.
4.Auburn (6-1)Texas (7-1)Notre Dame (7-1)Louisville (8-0)USC (8-1)Florida (10-1)Florida (11-1)Louisville (11-1)4.
5.West Virginia (6-0)West Virginia (7-0)West Virginia (7-0)California (8-1)Wisconsin (10-1)Wisconsin (11-1)Louisville (10-1)Wisconsin (11-1)5.
6.California (6-1)California (7-1)California (7-1)Notre Dame (8-1)Florida (9-1)Notre Dame (10-1)Wisconsin (11-1)Virginia Tech (10-2)6.
7.Texas (6-1)Auburn (7-1)USC (6-1)USC (7-1)Notre Dame (9-1)Louisville (9-1)Virginia Tech (10-2)Oklahoma (11-2)7.
8.Oregon (5-1)Notre Dame (6-1)Auburn (8-1)Florida (8-1)Louisville (8-1)West Virginia (9-1)LSU (10-2)USC (10-2)8.
9.Florida (6-1)Louisville (7-0)Florida (7-1)Wisconsin (9-1)West Virginia (8-1)Virginia Tech (9-2)Boise State (12-0)LSU (10-2)9.
10.Louisville (6-0)Wisconsin (7-1)Rutgers (8-0)Auburn (9-1)Arkansas (9-1)Arkansas (10-1)Notre Dame (10-2)Boise State (12-0)10.
11.Notre Dame (5-1)Florida (6-1)Tennessee (7-1)Rutgers (8-0)LSU (8-2)LSUOklahoma (10-2)Notre Dame (10-2)11.
12.Wisconsin (6-1)Clemson (7-1)Louisville (7-0)West Virginia (7-1)Boise State (10-0)Boise State (11-0)Rutgers (10-1)Wake Forest (11-2)12.
13.Boise State (7-0)Rutgers (7-0)Wisconsin (8-1)LSU (7-2)Wake Forest (9-1)Rutgers (9-1)Wake Forest (10-2)West Virginia (10-2)13.
14.Clemson (6-1)Tennessee (6-1)Boise State (8-0)Boise State (9-0)Texas (9-2)Oklahoma (9-2)Arkansas (10-2)Auburn (10-2)14.
15.Nebraska (6-1)Boise State (8-0)Boston College (7-1)Arkansas (8-1)Oklahoma (8-2)Texas (9-2)Auburn (10-2)Rutgers (10-2)15.
16.Georgia Tech (5-1)Boston College (6-1)Georgia Tech (6-2)Virginia Tech (7-2)Virginia Tech (8-2)Georgia Tech (9-2)Tennessee (9-3)Tennessee (9-3)16.
17.Tennessee (5-1)Arkansas (6-1)Virginia Tech (6-2)Georgia Tech (7-2)Georgia Tech (8-2)Auburn (10-2)West Virginia (9-2)Arkansas (10-3)17.
18.Rutgers (6-0)Nebraska (6-2)Arkansas (7-1)Oklahoma (7-2)Auburn (9-2)Wake Forest (9-2)Texas A&M (9-3)Texas A&M (9-3)18.
19.Arkansas (5-1)LSU (6-2)Clemson (7-2)Wake Forest (8-1)California (8-2)Tennessee (8-3)California (8-3)California (9-3)19.
20.LSU (5-2)Georgia Tech (5-2)Penn State (6-3)Tennessee (7-2)Maryland (8-2)Boston College (9-2)Penn State (8-4)Penn State (8-4)20.
21.Boston College (5-1)Penn State (5-3)Oklahoma (6-2)Maryland (7-2)Tennessee (7-3)California (8-3)TCU (9-2)TCU (10-2)21.
22.Penn State (4-3)Washington State (5-3)LSU (6-2)Oregon (7-2)Penn State (7-4)Penn State (8-4)Texas (9-3)Texas (9-3)22.
23.Texas A&M (6-1)Texas A&M (7-1)Washington State (6-3)Texas A&M (8-2)Boston College (8-2)Maryland (8-3)Georgia (8-4)Georgia (8-4)23.
24.Oklahoma (4-2)Missouri (7-1)Texas A&M (8-1)Penn State (6-4)TCU (7-2)TCU (8-2)Nebraska (9-3)UCLA (7-5)24.
25.Virginia Tech (4-2)Oregon (5-2)Oregon (6-2)Boston College (7-2)Oregon (7-3)Nebraska (8-3)Hawaii (10-2)BYU (10-2)25.
Week 8
Oct 14
Week 9
Oct 21
Week 10
Oct 28
Week 11
Nov 4
Week 12
Nov 11
Week 13
Nov 18
Week 14
Nov 25
Week 15
Dec 3
Dropped:
  • Oklahoma
  • Virginia Tech
Dropped:
  • Nebraska
  • Missouri
Dropped:
  • Clemson
  • Washington State
Dropped:
Texas A&M
Dropped:
Oregon
Dropped:
  • Georgia Tech
  • Boston College
  • Maryland
Dropped:
  • Nebraska
  • Hawaii

Colley Matrix

Wes Colley, creator of the Colley Matrix, has a Ph.D. from Princeton University in astrophysical sciences. He attended Virginia and is therefore a Virginia fan. His brother, Will Colley, played for Georgia. Colley claims 5 advantages using his system: [3]

While all computer systems are not biased towards the "Name recognition" of a school, Colley's system doesn't include any information that doesn't involve the current season. No pre-season poll and no carry-over from the previous season. Colley's focus on strength of schedule without including opponents' strength of schedule is unique.

Week 8
Oct 14
Week 9
Oct 21
Week 10
Oct 28
Week 11
Nov 4
Week 12
Nov 11
Week 13
Nov 18
Week 14
Nov 25
Week 15
Dec 3
1.USC (6-0)Michigan (8-0)Michigan (9-0)Michigan (10-0)Michigan (11-0)Ohio State (12-0)USC (10-1)Florida (11-1)1.
2.Michigan (7-0)Ohio State (8-0)Ohio State (9-0)Ohio State (10-0)Rutgers (8-0)USC (9-1)Ohio State (12-0)Ohio State (12-0)2.
3.Ohio State (7-0)USC (6-0)California (6-1)Louisville (8-0)Ohio State (11-0)Michigan (11-1)Florida (10-1)Michigan (11-1)3.
4.Florida (6-1)California (6-1)Florida (7-1)California (7-1)USC (8-1)Florida (9-1)Michigan (11-1)USC (10-2)4.
5.Auburn (6-1)Florida (6-1)Notre Dame (7-1)Florida (8-1)Florida (9-1)Louisville (9-1)Louisville (10-1)Louisville (11-1)5.
6.California (5-1)Rutgers (6-0)USC (6-1)Notre Dame (8-1)Notre Dame (9-1)Notre Dame (10-1)LSU (10-2)Boise State (11-0)6.
7.Rutgers (5-0)Notre Dame (6-1)Rutgers (7-0)Rutgers (7-0)Louisville (8-1)West Virginia (8-1)Boise State (11-0)LSU (10-2)7.
8.Notre Dame (5-1)Auburn (7-1)Louisville (7-0)USC (7-1)Wisconsin (9-1)Rutgers (8-1)Rutgers (9-1)Notre Dame (10-2)8.
9.Louisville (6-0)Louisville (7-0)Auburn (8-1)Auburn (9-1)Boise State (9-0)Wisconsin (10-1)Notre Dame (10-2)Auburn (10-2)9.
10.Boise State (6-0)Boise State (7-0)Tennessee (7-1)Texas (8-1)California (7-2)Arkansas (9-1)Auburn (10-2)Wisconsin (10-1)10.
11.Arkansas (4-1)Boston College (5-1)Boise State (7-0)Wisconsin (8-1)Arkansas (8-1)Boise State (10-0)Wisconsin (10-1)West Virginia (9-2)11.
12.Tennessee (5-1)Tennessee (6-1)West Virginia (6-0)Boise State (8-0)West Virginia (7-1)Auburn (10-2)Arkansas (9-2)California (8-3)12.
13.Boston College (4-1)West Virginia (6-0)Texas (7-1)West Virginia (6-1)Auburn (9-2)LSU (9-2)California (7-3)Oklahoma (11-2)13.
14.West Virginia (5-0)Texas (6-1)Wisconsin (7-1)Tennessee (7-2)LSU (8-2)California (7-3)Tennessee (9-3)Rutgers (9-2)14.
15.Oregon (5-1)Wisconsin (6-1)Boston College (6-1)Arkansas (7-1)Texas (8-2)Boston College (8-2)Virginia Tech (9-2)Tennessee (9-3)15.
16.Wisconsin (5-1)Arkansas (5-1)Texas A&M (7-1)LSU (7-2)Georgia Tech (7-2)Texas (8-2)Oklahoma (10-2)Arkansas (9-3)16.
17.Texas (5-1)Missouri (6-1)Arkansas (6-1)Georgia Tech (6-2)Wake Forest (8-1)Virginia Tech (8-2)West Virginia (8-2)Virginia Tech (9-2)17.
18.Missouri (5-1)Clemson (7-1)Georgia Tech (5-2)Oklahoma (7-2)Oklahoma (8-2)Oklahoma (9-2)Wake Forest (9-2)Wake Forest (10-2)18.
19.Tulsa (4-1)Texas A&M (6-1)Washington State (6-3)Boston College (6-2)Boston College (7-2)Georgia Tech (8-2)Texas (8-3)Oregon State (8-4)19.
20.Georgia Tech (4-1)Tulsa (5-1)Tulsa (6-1)Oregon (6-2)Maryland (7-2)Tennessee (8-3)BYU (10-2)Texas (8-3)20.
21.Nebraska (5-1)Wake Forest (5-1)Missouri (6-2)Wake Forest (7-1)Tennessee (7-3)Wake Forest (8-2)Oregon State (7-4)BYU (10-2)21.
22.Clemson (6-1)LSU (6-2)Clemson (7-2)Oregon State (5-3)Virginia Tech (7-2)BYU (9-2)Nebraska (8-3)Boston College (8-3)22.
23.Wake Forest (5-1)Washington State (5-3)Oklahoma (6-2)Maryland (6-2)Oregon (6-3)Clemson (8-3)Boston College (8-3)UCLA (7-5)23.
24.Texas A&M (5-1)Oregon (5-2)Oregon (5-2)Virginia Tech (6-2)Nebraska (7-3)Nebraska (7-3)Georgia Tech (8-3)Texas A&M (8-3)24.
25.LSU (5-2)Georgia Tech (4-2)LSU (6-2)Texas A&M (7-2)Clemson (8-3)MarylandTexas A&M (8-3)TCU (9-2)25.
Week 8
Oct 14
Week 9
Oct 21
Week 10
Oct 28
Week 11
Nov 4
Week 12
Nov 11
Week 13
Nov 18
Week 14
Nov 25
Week 15
Dec 3
Dropped:
Nebraska
Dropped:
Wake Forest
Dropped:
  • Washington State
  • Tulsa
  • Missouri
  • Clemson
Dropped:
  • Oregon State
  • Texas A&M
Dropped:
Oregon
Dropped:
  • Clemson
  • Maryland
Dropped:
  • Nebraska
  • Georgia Tech

Massey

Kenneth Massey is the owner of this complex computer system. He was a Ph.D. candidate of mathematics at Virginia Tech. Only the score, venue, and date of each game are used to calculate the Massey ratings. However, Massey calculates an offensive and defensive ratings which combine to produce a power ranking as well. The overall team rating is a merit based quantity, and is the result of applying a Bayesian win-loss correction to the power rating.

Week 8
Oct 14
Week 9
Oct 21
Week 10
Oct 28
Week 11
Nov 4
Week 12
Nov 11
Week 13
Nov 18
Week 14
Nov 25
Week 15
Dec 3
1.USCUSCMichiganMichiganMichiganOhio StateOhio StateOhio State1.
2.MichiganMichiganOhio StateOhio StateRutgersMichiganUSCFlorida2.
3.Ohio StateOhio StateCaliforniaLouisvilleUSCUSCFloridaMichigan3.
4.FloridaCaliforniaFloridaCaliforniaNotre DameFloridaMichiganUSC4.
5.AuburnAuburnAuburnFloridaFloridaArkansasLSULSU5.
6.CaliforniaFloridaNotre DameAuburnOhio StateNotre DameArkansasAuburn6.
7.ArkansasArkansasUSCNotre DameArkansasLouisvilleAuburnBoise State7.
8.Notre DameNotre DameTennesseeUSCLouisvilleWisconsinBoise StateArkansas8.
9.TennesseeTennesseeRutgersRutgersWisconsinAuburnLouisvilleLouisville9.
10.OregonRutgersLouisvilleArkansasCaliforniaWest VirginiaNotre DameCalifornia10.
11.Boise StateLouisvilleArkansasTennesseeWest VirginiaLSUCaliforniaNotre Dame11.
12.RutgersBoise StateBoise StateWisconsinBoise StateBoise StateTennesseeTennessee12.
13.LouisvilleWashington StateWashington StateBoise StateAuburnCaliforniaWisconsinWisconsin13.
14.Boston CollegeBoston CollegeWest VirginiaLSULSURutgersRutgersOregon State14.
15.TexasTexasTexasTexasTennesseeTennesseeOregon StateWest Virginia15.
Week 8
Oct 14
Week 9
Oct 21
Week 10
Oct 28
Week 11
Nov 4
Week 12
Nov 11
Week 13
Nov 18
Week 14
Nov 25
Week 15
Dec 3
Dropped:
  • Tulsa
  • Nebraska
  • Oklahoma
  • Iowa
Dropped:
Missouri
Dropped:
  • Clemson
  • Virginia Tech
Dropped:
Oregon State
Dropped:
  • Oregon
  • Maryland
  • Oklahoma
Dropped:
  • Georgia Tech
  • Boston College
  • Penn State
  • Texas
  • Clemson
None

Sagarin

Jeff Sagarin is the owner of this computer system published in USA Today. He olds an MBA from Indiana. This system uses the Elo Chess system where winning and losing are the sole factors. He also publishes a "Predictor" system that uses margin of victory. However, the BCS only uses the Elo Chess system.

Week 8
Oct 14
Week 9
Oct 21
Week 10
Oct 28
Week 11
Nov 4
Week 12
Nov 11
Week 13
Nov 18
Week 14
Nov 25
Week 15
Dec 3
1.USCUSCMichiganMichiganMichiganOhio StateOhio StateOhio State (12-0)1.
2.MichiganMichiganOhio StateOhio StateRutgersMichiganMichiganMichigan (11-1)2.
3.Ohio StateOhio StateCaliforniaNotre DameOhio StateUSCUSCFlorida (12-1)3.
4.ArkansasArkansasFloridaLouisvilleNotre DameNotre DameFloridaUSC (10-2)4.
5.FloridaAuburnUSCCaliforniaUSCArkansasLSULSU (10-2)5.
6.AuburnFloridaAuburnUSCWisconsinWisconsinBoise StateBoise State (12-0)6.
7.Notre DameCaliforniaNotre DameAuburnLouisvilleFloridaArkansasAuburn (10-2)7.
8.CaliforniaNotre DameTennesseeFloridaFloridaBoise StateAuburnWisconsin (11-1)8.
9.RutgersTennesseeArkansasArkansasArkansasLouisvilleNotre DameNotre Dame (10-2)9.
10.TennesseeRutgersBoise StateWisconsinBoise StateAuburnWisconsinArkansas (10-3)10.
11.Boise StateBoise StateRutgersBoise StateCaliforniaCaliforniaCaliforniaCalifornia (9-3)11.
12.OregonTexasWashington StateRutgersWest VirginiaLSUTennesseeTennessee (9-3)12.
13.WisconsinWashington StateTexasTexasAuburnWest VirginiaLouisvilleLouisville (11-1)13.
14.LouisvilleWisconsinLouisvilleLSULSURutgersRutgersOregon State (9-4)14.
Week 8
Oct 14
Week 9
Oct 21
Week 10
Oct 28
Week 11
Nov 4
Week 12
Nov 11
Week 13
Nov 18
Week 14
Nov 25
Week 15
Dec 3
Dropped:
  • Nebraska
  • Tulsa
NoneDropped:
Clemson
Dropped:
Oregon State
Dropped:
  • Oregon
  • Wake Forest
  • Maryland
Dropped:
  • Penn State
  • Georgia Tech
  • Boston College
  • Texas
  • Clemson
None

Wolfe

Peter Wolfe uses a Bradley-Terry model for his computer system. It uses wins and losses but also uses game location as a factor. In addition, he ranks all teams that can be connected by schedule played (over 700 involving Division I-A, I-AA, II, III and NAIA).

Week 8
Oct 14
Week 9
Oct 21
Week 10
Oct 28
Week 11
Nov 4
Week 12
Nov 11
Week 13
Nov 18
Week 14
Nov 25
Week 15
Dec 3
1.USCMichiganMichiganMichiganMichiganOhio StateOhio StateOhio State (12-0)1.
2.MichiganUSCOhio StateOhio StateRutgersMichiganMichiganMichigan (11-1)2.
3.Ohio StateOhio StateCaliforniaLouisvilleOhio StateUSCUSCFlorida (12-1)3.
4.FloridaRutgersNotre DameNotre DameNotre DameNotre DameFloridaUSC (10-2)4.
5.ArkansasFloridaFloridaFloridaLouisvilleFloridaLSULSU (10-2)5.
6.Notre DameCaliforniaUSCUSCUSCLouisvilleLouisvilleLouisville (11-1)6.
7.AuburnNotre DameLouisvilleCaliforniaWisconsinArkansasNotre DameNotre Dame (10-2)7.
8.CaliforniaArkansasRutgersTexasFloridaWest VirginiaArkansasBoise State (12-0)8.
9.LouisvilleAuburnTexasAuburnArkansasRutgersRutgersWisconsin (11-1)9.
10.RutgersLouisvilleTennesseeWisconsinBoise StateWisconsinBoise StateAuburn (10-2)10.
11.Boise StateTexasAuburnBoise StateWest VirginiaBoise StateWisconsinArkansas (10-3)11.
12.TennesseeClemsonBoise StateRutgersTexasLSUAuburnRutgers (10-2)12.
13.ClemsonWest VirginiaWest VirginiaArkansasCaliforniaTexasTennesseeCalifornia (9-3)13.
14.West VirginiaWisconsinArkansasWest VirginiaLSUAuburnCaliforniaTennessee (9-3)14.
15.OregonTennesseeWisconsinLSUGeorgia TechGeorgia TechOklahomaOklahoma (11-2)15.
16.WisconsinBoise StateBoston CollegeOklahomaMarylandCaliforniaVirginia TechWest Virginia (10-2)16.
17.NebraskaBoston CollegeWashington StateTennesseeAuburnBoston CollegeWest VirginiaWake Forest (11-2)17.
18.TexasMissouriOregonGeorgia TechWake ForestVirginia TechOregon State (9-4)18.
19.Boston CollegeClemsonMarylandBoston CollegePenn StateTexasVirginia Tech (10-2)19.
20.TulsaWashington StateOregonOklahomaTennesseeWake ForestPenn State (8-4)20.
Week 8
Oct 14
Week 9
Oct 21
Week 10
Oct 28
Week 11
Nov 4
Week 12
Nov 11
Week 13
Nov 18
Week 14
Nov 25
Week 15
Dec 3
Dropped:
  • Nebraska
  • Tulsa
Dropped:
LSU
Dropped:
  • Washington State
  • Clemson
  • Texas A&M
Dropped:
Oregon State
Dropped:
  • Maryland
  • Oregon
Dropped:
  • Boston College
  • Penn State
  • Clemson
Dropped:
  • Georgia Tech
  • Nebraska

Legend

 Increase in ranking
 Decrease in ranking
 Not ranked previous week
Italics Number of first place votes
(#-#) Win–loss record
тTied with team above or below also with this symbol

See also

Related Research Articles

<span class="mw-page-title-main">Bowl Championship Series</span> American college football playoff series

The Bowl Championship Series (BCS) was a selection system that created four or five bowl game match-ups involving eight or ten of the top ranked teams in the NCAA Division I Football Bowl Subdivision (FBS) of American college football, including an opportunity for the top two teams to compete in the BCS National Championship Game. The system was in place for the 1998 through 2013 seasons and in 2014 was replaced by the College Football Playoff.

The rating percentage index, commonly known as the RPI, is a quantity used to rank sports teams based upon a team's wins and losses and its strength of schedule. It is one of the sports rating systems by which NCAA basketball, baseball, softball, hockey, soccer, lacrosse, and volleyball teams are ranked. This system was in use from 1981 through 2018 to aid in the selecting and seeding of teams appearing in the NCAA Division I men's basketball tournament as well as in the women's tournament from its inception in 1982 through 2020.

Jeff Sagarin is an American sports statistician known for his development of a method for ranking and rating sports teams in a variety of sports. His Sagarin Ratings have been a regular feature in the USA Today sports section from 1985 to 2023, have been used by the NCAA Tournament Selection Committee to help determine the participants in the NCAA Men's Division I Basketball Championship tournament since 1984, and were part of the college football Bowl Championship Series throughout its history from 1998 to 2014.
<span class="mw-page-title-main">Sports rating system</span>

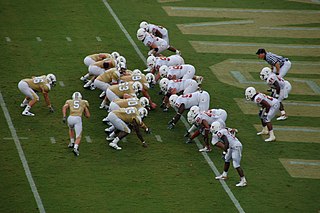
A sports rating system is a system that analyzes the results of sports competitions to provide ratings for each team or player. Common systems include polls of expert voters, crowdsourcing non-expert voters, betting markets, and computer systems. Ratings, or power ratings, are numerical representations of competitive strength, often directly comparable so that the game outcome between any two teams can be predicted. Rankings, or power rankings, can be directly provided, or can be derived by sorting each team's ratings and assigning an ordinal rank to each team, so that the highest rated team earns the #1 rank. Rating systems provide an alternative to traditional sports standings which are based on win–loss–tie ratios.

<span class="mw-page-title-main">BCS National Championship Game</span> American football game

The BCS National Championship Game, or BCS National Championship, was a postseason college football bowl game, used to determine a national champion of the NCAA Division I Football Bowl Subdivision (FBS), first played in the 1998 college football season as one of four designated bowl games, and beginning in the 2006 season as a standalone event rotated among the host sites of the aforementioned bowls.
<span class="mw-page-title-main">Auburn Tigers football</span> Football program

The Auburn Tigers football program represents Auburn University in the sport of American college football. Auburn competes in the Football Bowl Subdivision (FBS) of the National Collegiate Athletic Association (NCAA) and the Western Division of the Southeastern Conference (SEC).

<span class="mw-page-title-main">2001 NCAA Division I-A football season</span> American college football season

The 2001 NCAA Division I-A football season was the first college football season of the 21st century. It ended with the University of Miami winning the national title for the fifth time.

<span class="mw-page-title-main">2003 NCAA Division I-A football season</span> American college football season

The 2003 NCAA Division I-A football season ended with an abundance of controversy, resulting in the claim of a split national championship. This was the first claimed split title since the inception of the BCS, something the BCS intended to eliminate. Due to on-field circumstances, the BCS becoming a means of having a single champion going forward, and finally the four-team title playoff system's institution in 2014, as of 2024 this is the most recent Division 1-A season to end with split national champions.

<span class="mw-page-title-main">Kenneth Massey</span> American sports statistician (born 1975)

Kenneth Massey is an American sports statistician known for his development of a methodology for ranking and rating sports teams in a variety of sports. His ratings have been a part of the Bowl Championship Series since the 1999 season. He is an assistant professor of mathematics at Carson–Newman University in Tennessee.

The 2005 Rose Bowl Game was the 91st edition of the college football bowl game, held on January 1, 2005 at the self-named stadium in Pasadena, California. The Texas Longhorns, second-place finishers in the Big 12 Conference's South Division, defeated the Michigan Wolverines, co-champions of the Big Ten Conference, 38-37. Texas quarterback Vince Young and Michigan linebacker LaMarr Woodley were named the Rose Bowl Players of the Game, the first time that the Rose Bowl separately recognized an offensive and defensive player of the game.

<span class="mw-page-title-main">Conference USA Football Championship Game</span> American football game

The Conference USA Football Championship Game is an annual American football game that has determined the season champion of Conference USA (CUSA) since 2005.

In American college football, the 2007 BCS computer rankings are a part of the Bowl Championship Series (BCS) formula that determines who plays in the BCS National Championship Game as well as several other bowl games. Each computer system was developed using different methods which attempts to rank the teams' performance. For 2007, the highest and lowest rankings for a team are dropped and the remaining four rankings are summed. A team ranked #1 by a computer system is given 25 points, #2 is given 24 points and so forth. The summed values are then divided by 100. The values are then ranked by percentage. This percentage ranking is then averaged with the Coaches Poll and Harris Poll average rankings, each receiving equal weight, and the results become the BCS Rankings.

The Bowl Championship Series (BCS) was a selection system used between 1998 and 2013 that was designed, through polls and computer statistics, to determine a No. 1 and No. 2 ranked team in the NCAA Division I Football Bowl Subdivision (FBS). After the final polls, the two top teams were chosen to play in the BCS National Championship Game which determined the BCS national champion team, but not the champion team for independent voting systems. This format was intended to be "bowl-centered" rather than a traditional playoff system, since numerous FBS Conferences had expressed their unwillingness to participate in a play-off system. However, due to the unique and often esoteric nature of the BCS format, there had been controversy as to which two teams should play for the national championship and which teams should play in the four other BCS bowl games. In this selection process, the BCS was often criticized for conference favoritism, its inequality of access for teams in non-Automatic Qualifying (non-AQ) Conferences, and perceived monopolistic, "profit-centered" motives. In terms of this last concern, Congress explored the possibility on more than one occasion of holding hearings to determine the legality of the BCS under the terms of the Sherman Anti-Trust Act, and the United States Justice Department also periodically announced interest in investigating the BCS for similar reasons.

In sports, strength of schedule (SOS) refers to the difficulty or ease of a team's/person's opponent as compared to other teams/persons. This is especially important if teams in a league do not play each other the same number of times.

<span class="mw-page-title-main">2008 Utah Utes football team</span> American college football season

The 2008 Utah Utes football team represented the University of Utah in the 2008 NCAA Division I FBS football season. The team, coached by 4th year head football coach Kyle Whittingham, plays its home games in Rice-Eccles Stadium. Utah was one of only two teams in the top-level Division I FBS to finish the regular season undefeated, but after the Broncos were defeated by TCU in the Poinsettia Bowl and Utah won the Sugar Bowl over Alabama, the Utes finished as the nation's only undefeated team. It was the fifth undefeated and untied season in school history. During the 2008-2009 season, Utah defeated 4 teams that were ranked in the AP's final poll: #6 Alabama, #7 TCU, #18 Oregon State, and #25 BYU. Utah also began the season by defeating the Michigan Wolverines—ranked #24 at the time—in Ann Arbor. This resume propelled Utah to finish the season ranked #1 in four out of the six BCS computer models: Sagarin (Elo-Chess), Peter Wolfe, Anderson & Hester, and Massey.

<span class="mw-page-title-main">College football national championships in NCAA Division I FBS</span> Annual selection of best U.S. team

A national championship in the highest level of college football in the United States, currently the NCAA Division I Football Bowl Subdivision (FBS), is a designation awarded annually by various organizations to their selection of the best college football team. Division I FBS football is the only National Collegiate Athletic Association (NCAA) sport for which the NCAA does not sanction a yearly championship event. As such, it is sometimes referred to as a "mythical national championship".

David Rothman was an American statistician, public policy advisor, and the creator of a computerized college football ranking system.

<span class="mw-page-title-main">College Football Playoff</span> Postseason tournament in American college football

The College Football Playoff (CFP) is an annual postseason knockout invitational tournament to determine a national champion for the National Collegiate Athletic Association (NCAA) Division I Football Bowl Subdivision (FBS), the highest level of college football competition in the United States. It culminates in the College Football Playoff National Championship game. The inaugural tournament was held at the end of the 2014 NCAA Division I FBS football season under a four-team format. The CFP expands to include twelve teams for the 2024 season.

The Billingsley Report is a college football rating system developed in the late 1960s to determine a national champion. Billingsley has actively rated college football teams on a current basis since 1970. Beginning in 1999, Billingsley's ratings were included as one of seven mathematical formulas included in the Bowl Championship Series (BCS) rankings.

The Colley Matrix is a computer-generated sports rating system designed by Dr. Wesley Colley. It is one of more than 40 polls, rankings, and formulas recognized by the NCAA in its list of national champion selectors in college football.

References

  1. "The Only Original and Unaltered* BCS Computer Rankings..." Andersonsports.com. 2006-12-03. Archived from the original on 10 December 2006. Retrieved 2006-12-12.
  2. Richard Billingsley (2002-07-21). "IN SEARCH OF A NATIONAL CHAMPION". cfrc.com. Archived from the original on 2006-07-20. Retrieved 2006-12-12.
  3. Wes Colley (2006-12-12). "Advantages in this Method". ColleyRankings.com. Archived from the original on 6 December 2006. Retrieved 2006-12-12.