The Barrier layer in the ocean is a layer of water separating the well-mixed surface layer from the thermocline. [1]
The Barrier layer in the ocean is a layer of water separating the well-mixed surface layer from the thermocline. [1]
The thickness of the barrier layer is defined as the difference between mixed layer depth (MLD) calculated from temperature minus the mixed layer depth calculated using density. The first reference to this difference as the barrier layer was in a paper describing observations in the western Pacific as part of the Western Equatorial Pacific Ocean Circulation Study. [2] In regions where the barrier layer is present, stratification is stable because of strong buoyancy forcing associated with a fresh lens sitting on top of the water column.
In the past, a typical criterion for MLD was the depth at which the surface temperature cools by 0.2 °C (see e.g. DT-02 in the Figure). Prior to the subsurface salinity available from Argo, this was the main methodology for calculating the oceanic MLD. More recently, a density criterion has been used to define the MLD, defined as the depth where the density increases from the surface value due to a prescribed temperature decrease of 0.2 °C from the surface value while maintaining constant surface salinity value. In the Figure, this is defined by Dsigma and corresponds to an isothermal/isohaline layer. The BLT is the difference of the temperature-defined MLD minus the density-defined value (i.e. DT-02 - Dsigma).
Large values of the BLT are typically found in the equatorial regions and can be as high as 50 m. Above the barrier layer, the well mixed layer may be due to local precipitation exceeding evaporation (e.g. in the western Pacific), monsoon related river runoff (e.g. in the northern Indian Ocean), or advection of salty water subducted in the subtropics (found in all subtropical ocean gyres). BLT formation in the subtropics is associated with seasonal change in the mixed layer depth, a sharper gradient in sea surface salinity (SSS) than normal, and subduction across this SSS front. [3] In particular, BLT is formed in winter season in the equatorward flank of subtropical salinity maxima. During early winter, the atmosphere cools the surface and strong wind and negative buoyancy forcing mixes temperature to a deep layer. At this same time, fresh surface salinity is advected from the rainy regions in the tropics. The deep temperature layer along with strong stratification in the salinity gives the conditions for BLT formation. [4] For the western Pacific, the mechanism for BLT formation is different. Along the equator, the eastern edge of the warm pool (typically 28 °C isotherm - see SST plot in the western Pacific) is a demarcation region between warm fresh water to the west and cold, salty, upwelled water in the central Pacific. A barrier layer is formed in the isothermal layer when salty water is subducted from the east into the warm pool due to local convergence and warm fresh water overrides denser water to the east. Here, weak winds, heavy precipitation, eastward advection of low salinity water, westward subduction of salty water and downwelling equatorial Kelvin or Rossby waves are factors that contribute to deep BLT formation. [5]
Prior to El Nino, the warm pool stores heat and is confined to the far western Pacific. During the El Nino, the warm pool migrates eastward along with the concomitant precipitation and current anomalies. The fetch of the westerlies is increased during this time, reinforcing the event. Using data from ship of opportunity and Tropical Atmosphere – Ocean (TAO) moorings in the western Pacific, the east and west migration of the warm pool was tracked over 1992-2000 using sea surface salinity (SSS), sea surface temperature (SST), currents, and subsurface data on conductivity as a function of temperature and depth taken on various research cruises. [6] This work showed that during westward flow, the BLT in the western Pacific along the equator (138oE-145oE, 2oN-2oS) was between 18 m – 35 m corresponding with warm SST and serving as an efficient storage mechanism for heat. BLT formation is driven by westward (i.e. converging and subducting) currents along the equator near the eastern edge of the salinity front that defines the warm pool. These westward currents are driven by downwelling Rossby waves and represent either a westward advection of BLT or a preferential deepening of the deeper thermocline versus the shallower halocline due to Rossby wave dynamics (i.e. these waves favor vertical stretching of the upper water column). During El Nino, westerly winds drive the warm pool eastward allowing fresh water to ride on top of the local colder/saltier/denser water to the east.
Using coupled, atmospheric/ocean models and tuning the mixing to eliminate BLT for one year prior to El Nino, it was shown that the heat buildup associated with BLT is a requirement for big El Nino. [7] It has been shown that there is a tight relationship between SSS and SST in the western Pacific and the barrier layer is instrumental in maintaining heat and momentum in the warm pool within the salinity stratified layer. [8] Later work, including Argo drifters, confirm the relationship between eastward migration of the warm pool during El Nino and BLT heat storage in the western Pacific. [4] The main impact of BLT is to maintain a shallow mixed layer allowing an enhanced air-sea coupled response. In addition, the BLT is the key factor in establishing the mean state that is perturbed during El Nino/La Nina [9]

North Atlantic Deep Water (NADW) is a deep water mass formed in the North Atlantic Ocean. Thermohaline circulation of the world's oceans involves the flow of warm surface waters from the southern hemisphere into the North Atlantic. Water flowing northward becomes modified through evaporation and mixing with other water masses, leading to increased salinity. When this water reaches the North Atlantic it cools and sinks through convection, due to its decreased temperature and increased salinity resulting in increased density. NADW is the outflow of this thick deep layer, which can be detected by its high salinity, high oxygen content, nutrient minima, high 14C/12C, and chlorofluorocarbons (CFCs).

El Niño–Southern Oscillation (ENSO) is an irregular periodic variation in winds and sea surface temperatures over the tropical eastern Pacific Ocean, affecting the climate of much of the tropics and subtropics. The warming phase of the sea temperature is known as El Niño and the cooling phase as La Niña. The Southern Oscillation is the accompanying atmospheric component, coupled with the sea temperature change: El Niño is accompanied by high air surface pressure in the tropical western Pacific and La Niña with low air surface pressure there. The two periods last several months each and typically occur every few years with varying intensity per period.
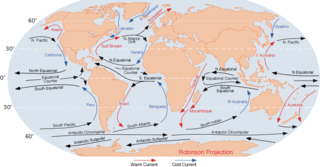
An ocean current is a continuous, directed movement of sea water generated by a number of forces acting upon the water, including wind, the Coriolis effect, breaking waves, cabbeling, and temperature and salinity differences. Depth contours, shoreline configurations, and interactions with other currents influence a current's direction and strength. Ocean currents are primarily horizontal water movements.
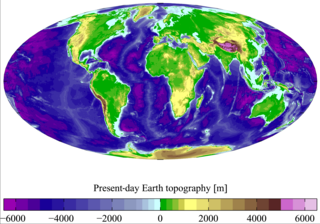
Physical oceanography is the study of physical conditions and physical processes within the ocean, especially the motions and physical properties of ocean waters.

The Indonesian Throughflow (ITF) is an ocean current with importance for global climate as is the low-latitude movement of warm, relative freshwater from the north Pacific to the Indian Ocean. It thus serves as a main upper branch of the global heat/salt conveyor belt.

Sea surface temperature (SST) is the water temperature close to the ocean's surface. The exact meaning of surface varies according to the measurement method used, but it is between 1 millimetre (0.04 in) and 20 metres (70 ft) below the sea surface. Air masses in the Earth's atmosphere are highly modified by sea surface temperatures within a short distance of the shore. Localized areas of heavy snow can form in bands downwind of warm water bodies within an otherwise cold air mass. Warm sea surface temperatures are known to be a cause of tropical cyclogenesis over the Earth's oceans. Tropical cyclones can also cause a cool wake, due to turbulent mixing of the upper 30 metres (100 ft) of the ocean. SST changes diurnally, like the air above it, but to a lesser degree. There is less SST variation on breezy days than on calm days. In addition, ocean currents such as the Atlantic Multidecadal Oscillation (AMO), can effect SST's on multi-decadal time scales, a major impact results from the global thermohaline circulation, which affects average SST significantly throughout most of the world's oceans.

The Pacific decadal oscillation (PDO) is a robust, recurring pattern of ocean-atmosphere climate variability centered over the mid-latitude Pacific basin. The PDO is detected as warm or cool surface waters in the Pacific Ocean, north of 20°N. Over the past century, the amplitude of this climate pattern has varied irregularly at interannual-to-interdecadal time scales. There is evidence of reversals in the prevailing polarity of the oscillation occurring around 1925, 1947, and 1977; the last two reversals corresponded with dramatic shifts in salmon production regimes in the North Pacific Ocean. This climate pattern also affects coastal sea and continental surface air temperatures from Alaska to California.
A subtropical front is a surface water mass boundary or front, which is a narrow zone of transition between air masses of contrasting density, air masses of different temperatures or different water vapour concentrates. It is also characterized by an unforeseen change in wind direction, and speed across its surface between water systems, which are based on temperature and salinity. The subtropical separates the more saline subtropical waters from the fresher sub-Antarctic waters.
Stratification is defined as the separation of water in layers based on a specific quantity. Two main types of stratification of water are uniform and layered stratification. Layered stratification occurs in all of the ocean basins. The stratified layers act as a barrier to the mixing of water, which can impact the exchange of heat, carbon, oxygen and other nutrients. Due to upwelling and downwelling, which are both wind-driven, mixing of different layers can occur by means of the rise of cold nutrient-rich and warm water, respectively. Generally, the layers are based on the density of water. Intuitively, heavier, and hence denser, water is located below the lighter water, representing a stable stratification. An example of a layer in the ocean is the pycnocline, which is defined as a layer in the ocean where the change in density is relatively large compared to the other layers in the ocean. The thickness of the thermocline is not constant everywhere, but depends on a variety of variables. Over the years stratification of the ocean basins has increased. An increase in stratification means that the differences in density of the layers in the oceans increase, leading to for example larger mixing barriers.
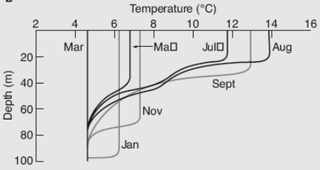
The oceanic or limnological mixed layer is a layer in which active turbulence has homogenized some range of depths. The surface mixed layer is a layer where this turbulence is generated by winds, surface heat fluxes, or processes such as evaporation or sea ice formation which result in an increase in salinity. The atmospheric mixed layer is a zone having nearly constant potential temperature and specific humidity with height. The depth of the atmospheric mixed layer is known as the mixing height. Turbulence typically plays a role in the formation of fluid mixed layers.
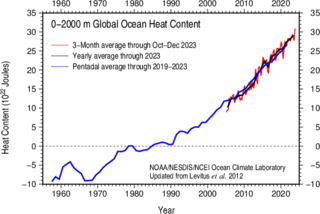
In oceanography and climatology, ocean heat content (OHC) is a term for the energy absorbed by the ocean, which is stored as internal energy or enthalpy. Changes in the ocean heat content play an important role in the sea level rise, because of thermal expansion.
Equatorial waves are oceanic and atmospheric waves trapped close to the equator, meaning that they decay rapidly away from the equator, but can propagate in the longitudinal and vertical directions. Wave trapping is the result of the Earth's rotation and its spherical shape which combine to cause the magnitude of the Coriolis force to increase rapidly away from the equator. Equatorial waves are present in both the tropical atmosphere and ocean and play an important role in the evolution of many climate phenomena such as El Niño. Many physical processes may excite equatorial waves including, in the case of the atmosphere, diabatic heat release associated with cloud formation, and in the case of the ocean, anomalous changes in the strength or direction of the trade winds.

The West Spitsbergen Current (WSC) is a warm, salty current that runs poleward just west of Spitsbergen,, in the Arctic Ocean. The WSC branches off the Norwegian Atlantic Current in the Norwegian Sea. The WSC is of importance because it drives warm and salty Atlantic Water into the interior Arctic. The warm and salty WSC flows north through the eastern side of Fram Strait, while the East Greenland Current (EGC) flows south through the western side of Fram Strait. The EGC is characterized by being very cold and low in salinity, but above all else it is a major exporter of Arctic sea ice. Thus, the EGC combined with the warm WSC makes the Fram Strait the northernmost ocean area having ice-free conditions throughout the year in all of the global ocean.
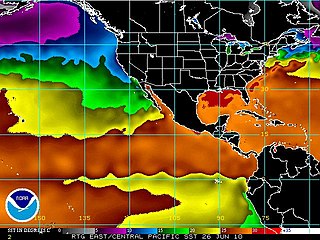
Tropical instability waves, often abbreviated TIW, are a phenomenon in which the interface between areas of warm and cold sea surface temperatures near the equator form a regular pattern of westward-propagating waves. These waves are often present in the Atlantic Ocean, extending westward from the African coast, but are more easily recognizable in the Pacific, extending westward from South America. They have an average period of about 30 days and wavelength of about 1100 kilometers, and are largest in amplitude between June and November. They are also largest during La Niña conditions, and may disappear when strong El Niño conditions are present.
In oceanography, Ekman velocity – also referred as a kind of the residual ageostropic velocity as it derivates from geostrophy – is part of the total horizontal velocity (u) in the upper layer of water of the open ocean. This velocity, caused by winds blowing over the surface of the ocean, is such that the Coriolis force on this layer is balanced by the force of the wind.
The Tropical Atmosphere Ocean (TAO) project is a major international effort that instrumented the entire tropical Pacific Ocean with approximately 70 deep ocean moorings. The development of the TAO array in 1985 was motivated by the 1982-1983 El Niño event and ultimately designed for the study of year-to-year climate variations related to El Niño and the Southern Oscillation (ENSO). Led by the TAO Project Office of the Pacific Marine Environmental Laboratory (PMEL), the full array of 70 moorings was completed in 1994.

Pacific Meridional Mode (PMM) is a climate mode in the North Pacific. In its positive state, it is characterized by the coupling of weaker trade winds in the northeast Pacific Ocean between Hawaii and Baja California with decreased evaporation over the ocean, thus increasing sea surface temperatures (SST); and the reverse during its negative state. This coupling develops during the winter months and spreads southwestward towards the equator and the central and western Pacific during spring, until it reaches the Intertropical Convergence Zone (ITCZ), which tends to shift north in response to a positive PMM.

The Southern Caribbean Upwelling system (SCUS) is a low latitude tropical upwelling system. Where; due to multiple environmental and bathymetric conditions water from the deep sea is forced to the surface layers of the ocean. The SCUS is located at about 10°N on the southern coast of the Caribbean sea basin off Colombia, Venezuela, and Trinidad.

Atlantification is the increasing influence of Atlantic water in the Arctic. Warm and salty Atlantic water is extending its reach Northward in the Arctic Ocean and is mixed with the cold Arctic water. Therefore the Arctic Ocean is becoming warmer and saltier and sea-ice is disappearing as a result. The process can be seen on the figure on the far right, where the sea surface temperature change in the past 50 years is shown, which is up to 5 degrees in some places. This change in the Arctic climate is most prominent in the Barents Sea, a shallow shelf sea North of Scandinavia where Atlantic water and Arctic water meet. The location of the Barents Sea is shown in the figure on the right. This is also the spot where sea-ice is dissapearing the quickest of the entire Arctic region, a change that influences all organisms living there and indirectly alters the climate of the entire planet.
Ocean dynamical thermostat is a physical mechanism through which changes in the mean radiative forcing influence the gradients of sea surface temperatures in the Pacific Ocean and the strength of the Walker circulation. Increased radiative forcing (warming) is more effective in the western Pacific than in the eastern where the upwelling of cold water masses damps the temperature change. This increases the east-west temperature gradient and strengthens the Walker circulation. Decreased radiative forcing (cooling) has the opposite effect.