C-chart

Last updated

c-chart
Originally proposed by Walter A. Shewhart
Process observations
Rational subgroup sizen > 1
Measurement typeNumber of nonconformances in a sample
Quality characteristic type Attributes data
Underlying distribution Poisson distribution
Performance
Size of shift to detect≥ 1.5σ
Process variation chart
Not applicable
Process mean chart
C control chart.svg
Center line
Control limits
Plotted statistic

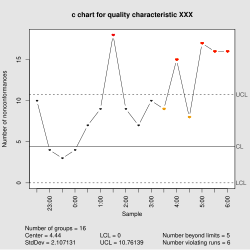
In statistical quality control, the c-chart is a type of control chart used to monitor "count"-type data, typically total number of nonconformities per unit. [1] It is also occasionally used to monitor the total number of events occurring in a given unit of time.

Statistical process control (SPC) is a method of quality control which employs statistical methods to monitor and control a process. This helps to ensure that the process operates efficiently, producing more specification-conforming products with less waste. SPC can be applied to any process where the "conforming product" output can be measured. Key tools used in SPC include run charts, control charts, a focus on continuous improvement, and the design of experiments. An example of a process where SPC is applied is manufacturing lines.

Control chart statistical process control tool

Control charts, also known as Shewhart charts or process-behavior charts, are a statistical process control tool used to determine if a manufacturing or business process is in a state of control. It is more appropriate to say that the control charts are the graphical device for Statistical Process Monitoring (SPM). Traditional control charts are mostly designed to monitor process parameters when underlying form of the process distributions are known. However, more advanced techniques are available in the 21st century where incoming data streaming can-be monitored even without any knowledge of the underlying process distributions. Distribution-free control charts are becoming increasingly popular.

The c-chart differs from the p-chart in that it accounts for the possibility of more than one nonconformity per inspection unit, and that (unlike the p-chart and u-chart) it requires a fixed sample size. The p-chart models "pass"/"fail"-type inspection only, while the c-chart (and u-chart) give the ability to distinguish between (for example) 2 items which fail inspection because of one fault each and the same two items failing inspection with 5 faults each; in the former case, the p-chart will show two non-conformant items, while the c-chart will show 10 faults.

p-chart

In statistical quality control, the p-chart is a type of control chart used to monitor the proportion of nonconforming units in a sample, where the sample proportion nonconforming is defined as the ratio of the number of nonconforming units to the sample size, n.

u-chart

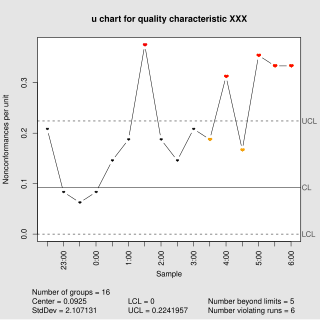
In statistical quality control, the u-chart is a type of control chart used to monitor "count"-type data where the sample size is greater than one, typically the average number of nonconformities per unit.

Nonconformities may also be tracked by type or location which can prove helpful in tracking down assignable causes.

Examples of processes suitable for monitoring with a c-chart include:

Casting Manufacturing process

Casting is a manufacturing process in which a liquid material is usually poured into a mold, which contains a hollow cavity of the desired shape, and then allowed to solidify. The solidified part is also known as a casting, which is ejected or broken out of the mold to complete the process. Casting materials are usually metals or various time setting materials that cure after mixing two or more components together; examples are epoxy, concrete, plaster and clay. Casting is most often used for making complex shapes that would be otherwise difficult or uneconomical to make by other methods. Heavy equipment like machine tool beds, ships' propellers, etc. can be cast easily in the required size, rather than fabricating by joining several small pieces.

Printed circuit board Board to support and connect electronic components

A printed circuit board (PCB) mechanically supports and electrically connects electronic components or electrical components using conductive tracks, pads and other features etched from one or more sheet layers of copper laminated onto and/or between sheet layers of a non-conductive substrate. Components are generally soldered onto the PCB to both electrically connect and mechanically fasten them to it.

The Poisson distribution is the basis for the chart and requires the following assumptions: [2]

Poisson distribution discrete probability distribution

In probability theory and statistics, the Poisson distribution, named after French mathematician Siméon Denis Poisson, is a discrete probability distribution that expresses the probability of a given number of events occurring in a fixed interval of time or space if these events occur with a known constant rate and independently of the time since the last event. The Poisson distribution can also be used for the number of events in other specified intervals such as distance, area or volume.

The control limits for this chart type are where is the estimate of the long-term process mean established during control-chart setup.

See also

Related Research Articles

Histogram graphical representation of the distribution of numerical data

A histogram is an accurate representation of the distribution of numerical data. It is an estimate of the probability distribution of a continuous variable and was first introduced by Karl Pearson. It differs from a bar graph, in the sense that a bar graph relates two variables, but a histogram relates only one. To construct a histogram, the first step is to "bin" the range of values—that is, divide the entire range of values into a series of intervals—and then count how many values fall into each interval. The bins are usually specified as consecutive, non-overlapping intervals of a variable. The bins (intervals) must be adjacent, and are often of equal size.

The t-test is any statistical hypothesis test in which the test statistic follows a Student's t-distribution under the null hypothesis.

Reliability engineering is a sub-discipline of systems engineering that emphasizes dependability in the lifecycle management of a product. Dependability, or reliability, describes the ability of a system or component to function under stated conditions for a specified period of time. Reliability is closely related to availability, which is typically described as the ability of a component or system to function at a specified moment or interval of time.

In process improvement efforts, defects per million opportunities or DPMO is a measure of process performance. It is defined as

<span class="texhtml mvar" style="font-style:italic;">x̅</span> and R chart

In statistical process monitoring (SPM), the and R chart is a type of scheme, popularly known as control chart, used to monitor the mean and range of a normally distributed variables simultaneously, when samples are collected at regular intervals from a business or industrial process.. It is often used to monitor the variables data but the performance of the and R chart may suffer when the normality assumption is not valid. This is connected traditional statistical quality control (SQC) and statistical process control (SPC). However, Woodall noted that "I believe that the use of control charts and other monitoring methods should be referred to as “statistical process monitoring,” not “statistical process control (SPC).”"

The combination of quality control and genetic algorithms led to novel solutions of complex quality control design and optimization problems. Quality control is a process by which entities review the quality of all factors involved in production. Quality is the degree to which a set of inherent characteristics fulfils a need or expectation that is stated, general implied or obligatory. Genetic algorithms are search algorithms, based on the mechanics of natural selection and natural genetics.

Shewhart individuals control chart

In statistical quality control, the individual/moving-range chart is a type of control chart used to monitor variables data from a business or industrial process for which it is impractical to use rational subgroups.

np-chart

In statistical quality control, the np-chart is a type of control chart used to monitor the number of nonconforming units in a sample. It is an adaptation of the p-chart and used in situations where personnel find it easier to interpret process performance in terms of concrete numbers of units rather than the somewhat more abstract proportion.

Weld quality assurance is the use of technological methods and actions to test or assure the quality of welds, and secondarily to confirm the presence, location and coverage of welds. In manufacturing, welds are used to join two or more metal surfaces. Because these connections may encounter loads and fatigue during product lifetime, there is a chance they may fail if not created to proper specification.

In statistical quality control, the CUSUM is a sequential analysis technique developed by E. S. Page of the University of Cambridge. It is typically used for monitoring change detection. CUSUM was announced in Biometrika, in 1954, a few years after the publication of Wald's SPRT algorithm.

<span class="texhtml mvar" style="font-style:italic;">x̅</span> and s chart

In statistical quality control, the and s chart is a type of control chart used to monitor variables data when samples are collected at regular intervals from a business or industrial process. This is connected traditional statistical quality control (SQC) and statistical process control (SPC). However, Woodall noted that "I believe that the use of control charts and other monitoring methods should be referred to as “statistical process monitoring,” not “statistical process control (SPC).”"

The acceptable quality limit (AQL) is the worst tolerable process average (mean) in percentage or ratio that is still considered acceptable; that is, it is at an acceptable quality level. Closely related terms are the rejectable quality limit and rejectable quality level (RQL). In a quality control procedure, a process is said to be at an acceptable quality level if the appropriate statistic used to construct a control chart does not fall outside the bounds of the acceptable quality limits. Otherwise, the process is said to be at a rejectable control level.

EWMA chart

In statistical quality control, the EWMA chart is a type of control chart used to monitor either variables or attributes-type data using the monitored business or industrial process's entire history of output. While other control charts treat rational subgroups of samples individually, the EWMA chart tracks the exponentially-weighted moving average of all prior sample means. EWMA weights samples in geometrically decreasing order so that the most recent samples are weighted most highly while the most distant samples contribute very little.

Acceptance sampling uses statistical sampling to determine whether to accept or reject a production lot of material. It has been a common quality control technique used in industry. It is usually done as products leaves the factory, or in some cases even within the factory. Most often a producer supplies a consumer a number of items and a decision to accept or reject the items is made by determining the number of defective items in a sample from the lot. The lot is accepted if the number of defects falls below where the acceptance number or otherwise the lot is rejected.

In statistics, the Cucconi test is a nonparametric test for jointly comparing central tendency and variability in two samples. Many rank tests have been proposed for the two-sample location-scale problem. Nearly all of them are Lepage-type tests, that is a combination of a location test and a scale test. The Cucconi test was first proposed by Cucconi.

In statistics, the Lepage test is an exactly distribution-free test for jointly monitoring the location and scale (variability) in two-sample treatment versus control comparisons. This is one of the most famous rank tests for the two-sample location-scale problem. The Lepage test statistic is the squared Euclidean distance of standardized Wilcoxon rank-sum test for location and the standardized Ansari–Bradley test for scale. The Lepage test was first introduced by Lepage, Y. in 1971 in a seminal paper in Biometrika. A large number of Lepage-type tests exists in statistical literature for simultaneously testing location and scale shifts in case-control studies. The details may be found in the book: Nonparametric statistical tests: A computational approach. Kössler, W. in 2006 also introduced various Lepage type tests using some alternative score functions optimal for various distributions. Dr. Amitava Mukherjee and Dr. Marco Marozzi introduced a class of percentile modified version of the Lepage test. An alternative to the Lepage-type tests is known as the Cucconi test proposed by Cucconi.

References

  1. "Counts Control Charts". NIST/Sematech Engineering Statistics Handbook. National Institute of Standards and Technology . Retrieved 2008-08-23.
  2. Montgomery, Douglas (2005). Introduction to Statistical Quality Control. Hoboken, New Jersey: John Wiley & Sons, Inc. p. 289. ISBN   978-0-471-65631-9. OCLC   56729567. Archived from the original on 2008-06-20. Retrieved 2008-08-23.