
A histogram is an approximate representation of the distribution of numerical data. It was first introduced by Karl Pearson. To construct a histogram, the first step is to "bin" the range of values—that is, divide the entire range of values into a series of intervals—and then count how many values fall into each interval. The bins are usually specified as consecutive, non-overlapping intervals of a variable. The bins (intervals) must be adjacent and are often of equal size.
The weighted arithmetic mean is similar to an ordinary arithmetic mean, except that instead of each of the data points contributing equally to the final average, some data points contribute more than others. The notion of weighted mean plays a role in descriptive statistics and also occurs in a more general form in several other areas of mathematics.
In finance, the binomial options pricing model (BOPM) provides a generalizable numerical method for the valuation of options. Essentially, the model uses a "discrete-time" model of the varying price over time of the underlying financial instrument, addressing cases where the closed-form Black–Scholes formula is wanting.

Control charts, also known as Shewhart charts or process-behavior charts, are a statistical process control tool used to determine if a manufacturing or business process is in a state of control. It is more appropriate to say that the control charts are the graphical device for Statistical Process Monitoring (SPM). Traditional control charts are mostly designed to monitor process parameters when underlying form of the process distributions are known. However, more advanced techniques are available in the 21st century where incoming data streaming can-be monitored even without any knowledge of the underlying process distributions. Distribution-free control charts are becoming increasingly popular.
The t-test is any statistical hypothesis test in which the test statistic follows a Student's t-distribution under the null hypothesis.
Sample size determination is the act of choosing the number of observations or replicates to include in a statistical sample. The sample size is an important feature of any empirical study in which the goal is to make inferences about a population from a sample. In practice, the sample size used in a study is usually determined based on the cost, time, or convenience of collecting the data, and the need for it to offer sufficient statistical power. In complicated studies there may be several different sample sizes: for example, in a stratified survey there would be different sizes for each stratum. In a census, data is sought for an entire population, hence the intended sample size is equal to the population. In experimental design, where a study may be divided into different treatment groups, there may be different sample sizes for each group.
The Western Electric rules are decision rules in statistical process control for detecting out-of-control or non-random conditions on control charts. Locations of the observations relative to the control chart control limits and centerline indicate whether the process in question should be investigated for assignable causes. The Western Electric rules were codified by a specially-appointed committee of the manufacturing division of the Western Electric Company and appeared in the first edition of a 1956 handbook, that became a standard text of the field. Their purpose was to ensure that line workers and engineers interpret control charts in a uniform way.

In statistical process monitoring (SPM), the and R chart is a type of scheme, popularly known as control chart, used to monitor the mean and range of a normally distributed variables simultaneously, when samples are collected at regular intervals from a business or industrial process.. It is often used to monitor the variables data but the performance of the and R chart may suffer when the normality assumption is not valid. This is connected to traditional statistical quality control (SQC) and statistical process control (SPC). However, Woodall noted that "I believe that the use of control charts and other monitoring methods should be referred to as “statistical process monitoring,” not “statistical process control (SPC).”"
In statistics, a binomial proportion confidence interval is a confidence interval for the probability of success calculated from the outcome of a series of success–failure experiments. In other words, a binomial proportion confidence interval is an interval estimate of a success probability p when only the number of experiments n and the number of successes nS are known.
In statistics, inter-rater reliability is the degree of agreement among raters. It is a score of how much homogeneity or consensus exists in the ratings given by various judges.
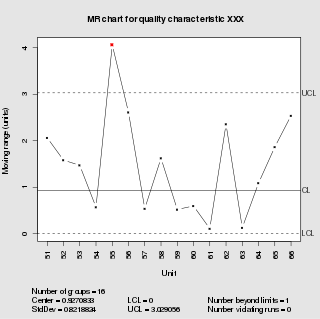
In statistical quality control, the individual/moving-range chart is a type of control chart used to monitor variables data from a business or industrial process for which it is impractical to use rational subgroups.

In statistical quality control, the np-chart is a type of control chart used to monitor the number of nonconforming units in a sample. It is an adaptation of the p-chart and used in situations where personnel find it easier to interpret process performance in terms of concrete numbers of units rather than the somewhat more abstract proportion.
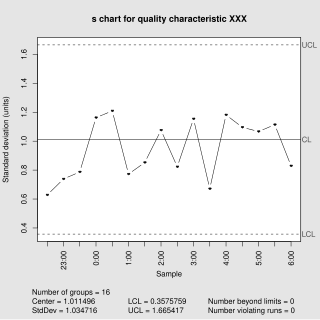
In statistical quality control, the and s chart is a type of control chart used to monitor variables data when samples are collected at regular intervals from a business or industrial process. This is connected to traditional statistical quality control (SQC) and statistical process control (SPC). However, Woodall noted that "I believe that the use of control charts and other monitoring methods should be referred to as “statistical process monitoring,” not “statistical process control (SPC).”"
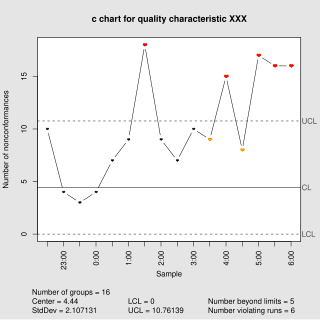
In statistical quality control, the c-chart is a type of control chart used to monitor "count"-type data, typically total number of nonconformities per unit. It is also occasionally used to monitor the total number of events occurring in a given unit of time.
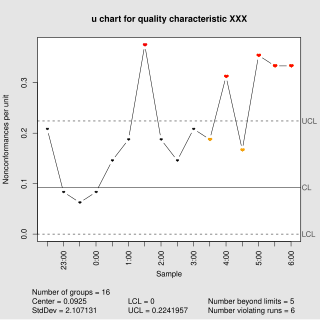
In statistical quality control, the u-chart is a type of control chart used to monitor "count"-type data where the sample size is greater than one, typically the average number of nonconformities per unit.

In statistical quality control, the EWMA chart is a type of control chart used to monitor either variables or attributes-type data using the monitored business or industrial process's entire history of output. While other control charts treat rational subgroups of samples individually, the EWMA chart tracks the exponentially-weighted moving average of all prior sample means. EWMA weights samples in geometrically decreasing order so that the most recent samples are weighted most highly while the most distant samples contribute very little.
Acceptance sampling uses statistical sampling to determine whether to accept or reject a production lot of material. It has been a common quality control technique used in industry. It is usually done as products leaves the factory, or in some cases even within the factory. Most often a producer supplies a consumer a number of items and a decision to accept or reject the items is made by determining the number of defective items in a sample from the lot. The lot is accepted if the number of defects falls below where the acceptance number or otherwise the lot is rejected.
Taylor's power law is an empirical law in ecology that relates the variance of the number of individuals of a species per unit area of habitat to the corresponding mean by a power law relationship. It is named after the ecologist who first proposed it in 1961, Lionel Roy Taylor (1924–2007). Taylor's original name for this relationship was the law of the mean.
In statistics, Dunnett's test is a multiple comparison procedure developed by Canadian statistician Charles Dunnett to compare each of a number of treatments with a single control. Multiple comparisons to a control are also referred to as many-to-one comparisons.
A variables sampling plan is an acceptance sampling technique. Plans for variables are intended for quality characteristics that are measured in a continuous scale. This plan requires the knowledge of the statistical model e.g. normal distribution. The historical evolution of this technique dates back to the seminal work of Wallis (1943). The purpose of a plan for variables is to assess whether the process is operating far enough from the specification limit. Plans for variables may produce a similar OC curve to attribute plans with significantly less sample size.


