Related Research Articles
Psychological statistics is application of formulas, theorems, numbers and laws to psychology. Statistical methods for psychology include development and application statistical theory and methods for modeling psychological data. These methods include psychometrics, factor analysis, experimental designs, and Bayesian statistics. The article also discusses journals in the same field.

Statistics is the discipline that concerns the collection, organization, analysis, interpretation, and presentation of data. In applying statistics to a scientific, industrial, or social problem, it is conventional to begin with a statistical population or a statistical model to be studied. Populations can be diverse groups of people or objects such as "all people living in a country" or "every atom composing a crystal". Statistics deals with every aspect of data, including the planning of data collection in terms of the design of surveys and experiments.
Factor analysis is a statistical method used to describe variability among observed, correlated variables in terms of a potentially lower number of unobserved variables called factors. For example, it is possible that variations in six observed variables mainly reflect the variations in two unobserved (underlying) variables. Factor analysis searches for such joint variations in response to unobserved latent variables. The observed variables are modelled as linear combinations of the potential factors plus "error" terms, hence factor analysis can be thought of as a special case of errors-in-variables models.
The g factor is a construct developed in psychometric investigations of cognitive abilities and human intelligence. It is a variable that summarizes positive correlations among different cognitive tasks, reflecting the fact that an individual's performance on one type of cognitive task tends to be comparable to that person's performance on other kinds of cognitive tasks. The g factor typically accounts for 40 to 50 percent of the between-individual performance differences on a given cognitive test, and composite scores based on many tests are frequently regarded as estimates of individuals' standing on the g factor. The terms IQ, general intelligence, general cognitive ability, general mental ability, and simply intelligence are often used interchangeably to refer to this common core shared by cognitive tests. However, the g factor itself is a mathematical construct indicating the level of observed correlation between cognitive tasks. The measured value of this construct depends on the cognitive tasks that are used, and little is known about the underlying causes of the observed correlations.

Response bias is a general term for a wide range of tendencies for participants to respond inaccurately or falsely to questions. These biases are prevalent in research involving participant self-report, such as structured interviews or surveys. Response biases can have a large impact on the validity of questionnaires or surveys.
In statistics, multicollinearity or collinearity is a situation where the predictors in a regression model are linearly dependent.

In statistics, the coefficient of determination, denoted R2 or r2 and pronounced "R squared", is the proportion of the variation in the dependent variable that is predictable from the independent variable(s).
In psychology, discriminant validity tests whether concepts or measurements that are not supposed to be related are actually unrelated.
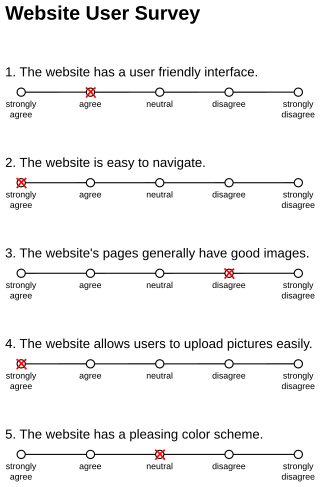
Acquiescence bias, also known as agreement bias, is a category of response bias common to survey research in which respondents have a tendency to select a positive response option or indicate a positive connotation disproportionately more frequently. Respondents do so without considering the content of the question or their 'true' preference. Acquiescence is sometimes referred to as "yea-saying" and is the tendency of a respondent to agree with a statement when in doubt. Questions affected by acquiescence bias take the following format: a stimulus in the form of a statement is presented, followed by 'agree/disagree,' 'yes/no' or 'true/false' response options. For example, a respondent might be presented with the statement "gardening makes me feel happy," and would then be expected to select either 'agree' or 'disagree.' Such question formats are favoured by both survey designers and respondents because they are straightforward to produce and respond to. The bias is particularly prevalent in the case of surveys or questionnaires that employ truisms as the stimuli, such as: "It is better to give than to receive" or "Never a lender nor a borrower be". Acquiescence bias can introduce systematic errors that affect the validity of research by confounding attitudes and behaviours with the general tendency to agree, which can result in misguided inference. Research suggests that the proportion of respondents who carry out this behaviour is between 10% and 20%.
In statistics, confirmatory factor analysis (CFA) is a special form of factor analysis, most commonly used in social science research. It is used to test whether measures of a construct are consistent with a researcher's understanding of the nature of that construct. As such, the objective of confirmatory factor analysis is to test whether the data fit a hypothesized measurement model. This hypothesized model is based on theory and/or previous analytic research. CFA was first developed by Jöreskog (1969) and has built upon and replaced older methods of analyzing construct validity such as the MTMM Matrix as described in Campbell & Fiske (1959).
Statistical conclusion validity is the degree to which conclusions about the relationship among variables based on the data are correct or "reasonable". This began as being solely about whether the statistical conclusion about the relationship of the variables was correct, but now there is a movement towards moving to "reasonable" conclusions that use: quantitative, statistical, and qualitative data. Fundamentally, two types of errors can occur: type I and type II. Statistical conclusion validity concerns the qualities of the study that make these types of errors more likely. Statistical conclusion validity involves ensuring the use of adequate sampling procedures, appropriate statistical tests, and reliable measurement procedures.
The multitrait-multimethod (MTMM) matrix is an approach to examining construct validity developed by Campbell and Fiske (1959). It organizes convergent and discriminant validity evidence for comparison of how a measure relates to other measures. The conceptual approach has influenced experimental design and measurement theory in psychology, including applications in structural equation models.

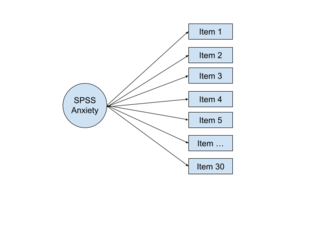
In multivariate statistics, exploratory factor analysis (EFA) is a statistical method used to uncover the underlying structure of a relatively large set of variables. EFA is a technique within factor analysis whose overarching goal is to identify the underlying relationships between measured variables. It is commonly used by researchers when developing a scale and serves to identify a set of latent constructs underlying a battery of measured variables. It should be used when the researcher has no a priori hypothesis about factors or patterns of measured variables. Measured variables are any one of several attributes of people that may be observed and measured. Examples of measured variables could be the physical height, weight, and pulse rate of a human being. Usually, researchers would have a large number of measured variables, which are assumed to be related to a smaller number of "unobserved" factors. Researchers must carefully consider the number of measured variables to include in the analysis. EFA procedures are more accurate when each factor is represented by multiple measured variables in the analysis.
Substitutes for leadership theory is a leadership theory first developed by Steven Kerr and John M. Jermier and published in Organizational Behavior and Human Performance in December 1978.
Measurement invariance or measurement equivalence is a statistical property of measurement that indicates that the same construct is being measured across some specified groups. For example, measurement invariance can be used to study whether a given measure is interpreted in a conceptually similar manner by respondents representing different genders or cultural backgrounds. Violations of measurement invariance may preclude meaningful interpretation of measurement data. Tests of measurement invariance are increasingly used in fields such as psychology to supplement evaluation of measurement quality rooted in classical test theory.
Philip Michael Podsakoff is an American management professor, researcher, author, and consultant who held the John F. Mee Chair of Management at Indiana University. Currently, he is the Hyatt and Cici Brown Chair in Business at the University of Florida.

WarpPLS is a software with graphical user interface for variance-based and factor-based structural equation modeling (SEM) using the partial least squares and factor-based methods. The software can be used in empirical research to analyse collected data and test hypothesized relationships. Since it runs on the MATLAB Compiler Runtime, it does not require the MATLAB software development application to be installed; and can be installed and used on various operating systems in addition to Windows, with virtual installations.
In statistics, confirmatory composite analysis (CCA) is a sub-type of structural equation modeling (SEM). Although, historically, CCA emerged from a re-orientation and re-start of partial least squares path modeling (PLS-PM), it has become an independent approach and the two should not be confused. In many ways it is similar to, but also quite distinct from confirmatory factor analysis (CFA). It shares with CFA the process of model specification, model identification, model estimation, and model assessment. However, in contrast to CFA which always assumes the existence of latent variables, in CCA all variables can be observable, with their interrelationships expressed in terms of composites, i.e., linear compounds of subsets of the variables. The composites are treated as the fundamental objects and path diagrams can be used to illustrate their relationships. This makes CCA particularly useful for disciplines examining theoretical concepts that are designed to attain certain goals, so-called artifacts, and their interplay with theoretical concepts of behavioral sciences.
Common source bias is a type of sampling bias, occurring when both dependent and independent variables are collected from the same group of people. This bias can occur in various forms of research, such as surveys, experiments, and observational studies. Some scholars believe that common source bias is a significant concern for any study as it can lead to unreliable results, and therefore must be controlled. It is most prevalent in the field of public administration research, where performance measures subject to common source bias can produce false positives when organisational performance is evaluated with explanatory and perceptual measures from the same source.

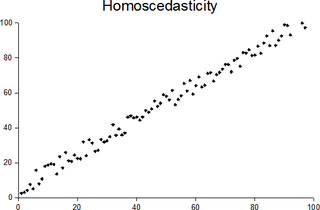
In statistics, a sequence of random variables is homoscedastic if all its random variables have the same finite variance; this is also known as homogeneity of variance. The complementary notion is called heteroscedasticity, also known as heterogeneity of variance. The spellings homoskedasticity and heteroskedasticity are also frequently used. “Skedasticity” comes from the Ancient Greek word “skedánnymi”, meaning “to scatter”. Assuming a variable is homoscedastic when in reality it is heteroscedastic results in unbiased but inefficient point estimates and in biased estimates of standard errors, and may result in overestimating the goodness of fit as measured by the Pearson coefficient.
References
- 1 2 Podsakoff, P.M.; MacKenzie, S.B.; Lee, J.-Y.; Podsakoff, N.P. (October 2003). "Common method biases in behavioral research: A critical review of the literature and recommended remedies" (PDF). Journal of Applied Psychology. 88 (5): 879–903. doi:10.1037/0021-9010.88.5.879. hdl: 2027.42/147112 . PMID 14516251.
- 1 2 Richardson, H.A.; Simmering, M.J.; Sturman, M.C. (October 2009). "A tale of three perspectives: Examining post hoc statistical techniques for detection and correction of common method variance". Organizational Research Methods. 12 (4): 762–800. doi:10.1177/1094428109332834. hdl: 1813/72364 .
- ↑ Williams, L. J.; Brown, B. K. (1994). "Method variance in organizational behavior and human resources research: Effects on correlations, path coefficients, and hypothesis testing". Organizational Behavior and Human Decision Processes. 57 (2): 185–209. doi:10.1006/obhd.1994.1011.
- ↑ Spector, P. E. (2006). "Method Variance in Organizational Research: Truth or Urban Legend?". Organizational Research Methods. 9 (2): 221–232. doi:10.1177/1094428105284955.
- ↑ Chang, S.-J.; van Witteloostuijn, A.; Eden, L. (2010). "Common method variance in international business research". Journal of International Business Studies. 41: 178–184. doi: 10.1057/jibs.2009.88 .
- ↑ Lindell, M. K.; Whitney, D. J. (2001). "Accounting for common method variance in cross-sectional research designs". Journal of Applied Psychology. 86 (1): 114–121. doi:10.1037/0021-9010.86.1.114. PMID 11302223.
- ↑ Williams, L.J.; Hartman, N.; Cavazotte, F. (July 2010). "Method variance and marker variables: A review and comprehensive CFA marker technique". Organizational Research Methods. 13 (3): 477–514. doi:10.1177/1094428110366036.
- ↑ Kock, N. (2015). Common method bias in PLS-SEM: A full collinearity assessment approach. International Journal of e-Collaboration, 11(4), 1-10.
- ↑ Kock, N.; Lynn, G. S. (2012). "Lateral collinearity and misleading results in variance-based SEM: An illustration and recommendations" (PDF). Journal of the Association for Information Systems. 13 (7): 546–580. doi:10.17705/1jais.00302.