Computed tomography imaging spectrometer

Last updated
The optical layout and reconstruction step of a CTIS instrument. Shown here is an example in which the device is imaging the university of Arizona's logo, uses a kinoform grating to disperse the transmitted light, and measures a 3 x 3 dispersion pattern on the detector array. Optical layout and reconstruction of CTIS image.png
The optical layout and reconstruction step of a CTIS instrument. Shown here is an example in which the device is imaging the university of Arizona's logo, uses a kinoform grating to disperse the transmitted light, and measures a 3 × 3 dispersion pattern on the detector array.

The computed tomography imaging spectrometer (CTIS) is a snapshot imaging spectrometer which can produce in fine the three-dimensional (i.e. spatial and spectral) hyperspectral datacube of a scene.

Contents

History

The CTIS was conceived separately by Takayuki Okamoto and Ichirou Yamaguchi at Riken (Japan), and by F. Bulygin and G. Vishnakov in Moscow (Russia). [1] [2] [3] The concept was subsequently further developed by Michael Descour, at the time a PhD student at the University of Arizona, under the direction of Prof. Eustace Dereniak. [4]

The first research experiments based on CTIS imaging were conducted in the fields of molecular biology. [5] Several improvements of the technology have been proposed since then, in particular regarding the hardware: dispersive elements providing more information on the datacube, [6] enhanced calibration of the system. [7] The enhancement of the CTIS was also fueled by the general development of bigger image sensors. [8] For academic purposes, although not as widely used as other spectrometers, CTIS has been employed in applications ranging from the military [9] to ophthalmology [10] and astronomy. [11]

Image formation

Formation of a CTIS image, viewed as mechanical projections of a theoretical datacube. Image inspired by the work of Descour. Formation of a CTIS image.png
Formation of a CTIS image, viewed as mechanical projections of a theoretical datacube. Image inspired by the work of Descour.

Optical layout

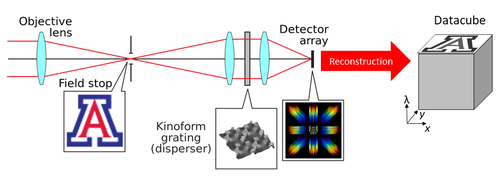
The optical layout of a CTIS instrument is shown on the left part of the top image. A field stop is placed at the image plane of an objective lens, after which a lens collimates the light before it passes through a disperser (such as a grating or a prism). Finally, a re-imaging lens maps the dispersed image of the field stop onto a large-format detector array.

Resulting image

The information that the CTIS acquires can be seen as the three-dimensional datacube of the scene. Of course, this cube does not exist in physical space as mechanical objects do, but this representation helps to gain intuition on what the image is capturing: As seen in the figure on the right, the shapes on the image can be considered as projections (in a mechanical sense) of the datacube.

Image of a CTIS acquisition. The acquired object is a number written on a transparent screen, illuminated by a LED light. Image of a number acquired by CTIS.png
Image of a CTIS acquisition. The acquired object is a number written on a transparent screen, illuminated by a LED light.

The central projection, called the 0th order of diffraction, is the sum of the datacube following the spectral axis (hence, this projection acts as a panchromatic camera). In the image of the "5" on the right, one can clearly read the number in the central projection, but with no information regarding the spectre of the light.

All the other projections result from "looking" at the cube obliquely and hence contain a mixture of spatial and spectral information. From a discrete point of view where the datacube is considered as a set of spectral slices (as in the figure above, where two such slices are represented in purple and red), one can understand these projections as a partial spread of the stack of slices, similarly to a magician spreading his cards in order for an audience member to pick one of them. It is important to note that for typical spectral dispersions and the typical size of a sensor, the spectral information of a given slice is heavily overlapping with the one from other neighboring slices. In the "5" image, one can see in the side projections that the number is not clearly readable (loss of spatial information), but that some spectral information is available (i.e. some wavelengths appear brighter than others). Hence, the image contains multiplexed information regarding the datacube.

The number and layout of the projections depend on the type of diffracting element employed. In particular, more than one order of diffraction can be captured. [6]

Datacube reconstruction

The resulting image contains all of the information of the datacube. It is necessary to carry out a reconstruction algorithm to convert this image back in the 3D spatio-spectral space. Hence, the CTIS is a computational imaging system.

Conceptually, one can consider each of the projections of the datacube in a manner analogous to the X-ray projections measured by medical X-ray computed tomography instruments used to estimate the volume distribution within a patient's body.

Similarities between X-ray CT and CTIS acquisitions
X-ray CTCTIS
Object to acquireSlice of a patient's body (2D)Spatio-spectral datacube (3D)
Penetrating waveX-rayLight from the scene
Projection generatorTransmitters rotating around an axisDispersive element
Image acquiredSinogramCTIS multiplexed image

Hence, the most widely-used algorithms for CTIS reconstruction are the same as the one used in the X-ray CT field of study. In particular, the algorithm used by Descour [12] is directly taken from a seminal work in X-ray CT reconstruction. [13] Since then, slightly more elaborate techniques have been employed, [8] in the same way (but not to the same extent) X-ray CT reconstruction has improved since the 80s.

Difficulties

Compared to the X-ray CT field, CTIS reconstruction is notoriously more difficult. In particular, the number of projections resulting from a CTIS acquisition is typically far less than in X-ray CT. This results in a blurrier reconstruction, following the projection-slice theorem. Moreover, unlike X-ray CT where projections are acquired around the patient, the CTIS, as all imaging systems, only acquires the scene from a single point of view, and hence many projection angles are unobtainable.

Related Research Articles

<span class="mw-page-title-main">CT scan</span> Medical imaging procedure using X-rays to produce cross-sectional images

A computed tomography scan is a medical imaging technique used to obtain detailed internal images of the body. The personnel that perform CT scans are called radiographers or radiology technologists.

<span class="mw-page-title-main">Single-photon emission computed tomography</span> Nuclear medicine tomographic imaging technique

Single-photon emission computed tomography is a nuclear medicine tomographic imaging technique using gamma rays. It is very similar to conventional nuclear medicine planar imaging using a gamma camera, but is able to provide true 3D information. This information is typically presented as cross-sectional slices through the patient, but can be freely reformatted or manipulated as required.

<span class="mw-page-title-main">Tomography</span> Imaging by sections or sectioning using a penetrative wave

Tomography is imaging by sections or sectioning that uses any kind of penetrating wave. The method is used in radiology, archaeology, biology, atmospheric science, geophysics, oceanography, plasma physics, materials science, astrophysics, quantum information, and other areas of science. The word tomography is derived from Ancient Greek τόμος tomos, "slice, section" and γράφω graphō, "to write" or, in this context as well, "to describe." A device used in tomography is called a tomograph, while the image produced is a tomogram.

<span class="mw-page-title-main">Optical coherence tomography</span> Imaging technique

Optical coherence tomography (OCT) is an imaging technique that uses low-coherence light to capture micrometer-resolution, two- and three-dimensional images from within optical scattering media. It is used for medical imaging and industrial nondestructive testing (NDT). Optical coherence tomography is based on low-coherence interferometry, typically employing near-infrared light. The use of relatively long wavelength light allows it to penetrate into the scattering medium. Confocal microscopy, another optical technique, typically penetrates less deeply into the sample but with higher resolution.

<span class="mw-page-title-main">Tomographic reconstruction</span> Estimate object properties from a finite number of projections

Tomographic reconstruction is a type of multidimensional inverse problem where the challenge is to yield an estimate of a specific system from a finite number of projections. The mathematical basis for tomographic imaging was laid down by Johann Radon. A notable example of applications is the reconstruction of computed tomography (CT) where cross-sectional images of patients are obtained in non-invasive manner. Recent developments have seen the Radon transform and its inverse used for tasks related to realistic object insertion required for testing and evaluating computed tomography use in airport security.

<span class="mw-page-title-main">X-ray microtomography</span> X-ray 3D imaging method

In radiography, X-ray microtomography uses X-rays to create cross-sections of a physical object that can be used to recreate a virtual model without destroying the original object. It is similar to tomography and X-ray computed tomography. The prefix micro- is used to indicate that the pixel sizes of the cross-sections are in the micrometre range. These pixel sizes have also resulted in creation of its synonyms high-resolution X-ray tomography, micro-computed tomography, and similar terms. Sometimes the terms high-resolution computed tomography (HRCT) and micro-CT are differentiated, but in other cases the term high-resolution micro-CT is used. Virtually all tomography today is computed tomography.

<span class="mw-page-title-main">Imaging spectroscopy</span>

In imaging spectroscopy each pixel of an image acquires many bands of light intensity data from the spectrum, instead of just the three bands of the RGB color model. More precisely, it is the simultaneous acquisition of spatially coregistered images in many spectrally contiguous bands.

<span class="mw-page-title-main">Hyperspectral imaging</span> Multi-wavelength imaging method

Hyperspectral imaging collects and processes information from across the electromagnetic spectrum. The goal of hyperspectral imaging is to obtain the spectrum for each pixel in the image of a scene, with the purpose of finding objects, identifying materials, or detecting processes. There are three general types of spectral imagers. There are push broom scanners and the related whisk broom scanners, which read images over time, band sequential scanners, which acquire images of an area at different wavelengths, and snapshot hyperspectral imagers, which uses a staring array to generate an image in an instant.

<span class="mw-page-title-main">Imaging spectrometer</span>

An imaging spectrometer is an instrument used in hyperspectral imaging and imaging spectroscopy to acquire a spectrally-resolved image of an object or scene, often referred to as a datacube due to the three-dimensional representation of the data. Two axes of the image correspond to vertical and horizontal distance and the third to wavelength. The principle of operation is the same as that of the simple spectrometer, but special care is taken to avoid optical aberrations for better image quality.

Multivariate optical computing, also known as molecular factor computing, is an approach to the development of compressed sensing spectroscopic instruments, particularly for industrial applications such as process analytical support. "Conventional" spectroscopic methods often employ multivariate and chemometric methods, such as multivariate calibration, pattern recognition, and classification, to extract analytical information from data collected at many different wavelengths. Multivariate optical computing uses an optical computer to analyze the data as it is collected. The goal of this approach is to produce instruments which are simple and rugged, yet retain the benefits of multivariate techniques for the accuracy and precision of the result.

Terahertz tomography is a class of tomography where sectional imaging is done by terahertz radiation. Terahertz radiation is electromagnetic radiation with a frequency between 0.1 and 10 THz; it falls between radio waves and light waves on the spectrum; it encompasses portions of the millimeter waves and infrared wavelengths. Because of its high frequency and short wavelength, terahertz wave has a high signal-to-noise ratio in the time domain spectrum. Tomography using terahertz radiation can image samples that are opaque in the visible and near-infrared regions of the spectrum. Terahertz wave three-dimensional (3D) imaging technology has developed rapidly since its first successful application in 1997, and a series of new 3D imaging technologies have been proposed successively.

<span class="mw-page-title-main">Tomosynthesis</span>

Tomosynthesis, also digital tomosynthesis (DTS), is a method for performing high-resolution limited-angle tomography at radiation dose levels comparable with projectional radiography. It has been studied for a variety of clinical applications, including vascular imaging, dental imaging, orthopedic imaging, mammographic imaging, musculoskeletal imaging, and chest imaging.

<span class="mw-page-title-main">Integral field spectrograph</span> Spectrograph equipped with an integral field unit

Integral field spectrographs (IFS) combine spectrographic and imaging capabilities in the optical or infrared wavelength domains (0.32 μm – 24 μm) to get from a single exposure spatially resolved spectra in a bi-dimensional region. The name originates from the fact that the mesurements result from integrating the light on multiple sub-regions of the field. Developed at first for the study of astronomical objects, this technique is now also used in many other fields, such bio-medical science and Earth remote sensing. Integral field spectrography is part of the broader category of snapshot hyperspectral imaging techniques, itself a part of hyperspectral imaging.

<span class="mw-page-title-main">Optical projection tomography</span>

Optical projection tomography is a form of tomography involving optical microscopy. The OPT technique is sometimes referred to as Optical Computed Tomography (optical-CT) and Optical Emission Computed Tomography (optical-ECT) in the literature, to address the fact that the technique bears similarity to X-ray computed tomography (CT) and single-photon emission computed tomography (SPECT).

<span class="mw-page-title-main">Snapshot hyperspectral imaging</span> Method for capturing hyperspectral images

Snapshot hyperspectral imaging is a method for capturing hyperspectral images during a single integration time of a detector array. No scanning is involved with this method, in contrast to push broom and whisk broom scanning techniques. The lack of moving parts means that motion artifacts should be avoided. This instrument typically features detector arrays with a high number of pixels.

Video spectroscopy combines spectroscopic measurements with video technique. This technology has resulted from recent developments in hyperspectral imaging. A video capable imaging spectrometer can work like a camcorder and provide full frame spectral images in real-time that enables advanced mobility and hand-held imaging spectroscopy. Unlike hyperspectral line scanners, a video spectrometer can spectrally capture randomly and quickly moving objects and processes. The product of a conventional hyperspectral line scanner has typically been called a hyperspectral data cube. A video spectrometer produces a spectral image data series at much higher speeds (1 ms) and frequencies (25 Hz) that is called a hyperspectral video. This technology can initiate novel solutions and challenges in spectral tracking, field spectroscopy, spectral mobile mapping, real-time spectral monitoring and many other applications.

Photon etc. is a Canadian manufacturer of infrared cameras, widely tunable optical filters, hyperspectral imaging and spectroscopic scientific instruments for academic and industrial applications. Its main technology is based on volume Bragg gratings, which are used as filters either for swept lasers or for global imaging.

Computational imaging is the process of indirectly forming images from measurements using algorithms that rely on a significant amount of computing. In contrast to traditional imaging, computational imaging systems involve a tight integration of the sensing system and the computation in order to form the images of interest. The ubiquitous availability of fast computing platforms, the advances in algorithms and modern sensing hardware is resulting in imaging systems with significantly enhanced capabilities. Computational Imaging systems cover a broad range of applications include computational microscopy, tomographic imaging, MRI, ultrasound imaging, computational photography, Synthetic Aperture Radar (SAR), seismic imaging etc. The integration of the sensing and the computation in computational imaging systems allows for accessing information which was otherwise not possible. For example:

Photon-counting computed tomography (PCCT) is a form of X-ray computed tomography (CT) in which X-rays are detected using a photon-counting detector (PCD) which registers the interactions of individual photons. By keeping track of the deposited energy in each interaction, the detector pixels of a PCD each record an approximate energy spectrum, making it a spectral or energy-resolved CT technique. In contrast, more conventional CT scanners use energy-integrating detectors (EIDs), where the total energy deposited in a pixel during a fixed period of time is registered. These EIDs thus register only photon intensity, comparable to black-and-white photography, whereas PCDs register also spectral information, similar to color photography.

Spectral imaging is an umbrella term for energy-resolved X-ray imaging in medicine. The technique makes use of the energy dependence of X-ray attenuation to either increase the contrast-to-noise ratio, or to provide quantitative image data and reduce image artefacts by so-called material decomposition. Dual-energy imaging, i.e. imaging at two energy levels, is a special case of spectral imaging and is still the most widely used terminology, but the terms "spectral imaging" and "spectral CT" have been coined to acknowledge the fact that photon-counting detectors have the potential for measurements at a larger number of energy levels.

References

  1. Takayuki Okamoto and Ichirou Yamaguchi, "Simultaneous acquisition of spectral image information", Optics Letters16: 1277-1279 (1991).
  2. Takayuki Okamoto, Akinori Takahashi, and Ichirou Yamaguchi, "Simultaneous acquisition of spectral and spatial intensity distribution", Applied Spectroscopy47: 1198-1202 (1993)
  3. F. V. Bulygin and G. N. Vishnyakov, "Spectrotomography -- a new method of obtaining spectrograms of two-dimensional objects", in Analytical Methods for Optical Tomography, Proc. SPIE 1843: 315-322 (1992).
  4. Michael Robert Descour, "Non-scanning imaging spectrometry", PhD Thesis, University of Arizona (1994)
  5. Ford, Bridget K.; Volin, Curtis E.; Murphy, Sean M.; Lynch, Ronald M.; Descour, Michael R. (February 2001). "Computed Tomography-Based Spectral Imaging For Fluorescence Microscopy". Biophysical Journal. 80 (2): 986–993. Bibcode:2001BpJ....80..986F. doi:10.1016/s0006-3495(01)76077-8. ISSN   0006-3495. PMC   1301296 . PMID   11159465.
  6. 1 2 Hagen, Nathan; Dereniak, Eustace L.; Sass, David T. (2006-08-31). Shen, Sylvia S; Lewis, Paul E (eds.). "Maximizing the resolution of a CTIS instrument". SPIE Proceedings. Imaging Spectrometry XI. SPIE. 6302: 63020L. Bibcode:2006SPIE.6302E..0LH. doi:10.1117/12.680750. S2CID   120974275.
  7. Wilson, Daniel W.; Maker, Paul D.; Muller, Richard E. (1997-10-31). Descour, Michael R; Shen, Sylvia S (eds.). "<title>Reconstructions of computed-tomography imaging spectrometer image cubes using calculated system matrices</title>". SPIE Proceedings. Imaging Spectrometry III. SPIE. 3118: 184–193. Bibcode:1997SPIE.3118..184W. doi:10.1117/12.283827. S2CID   136914912.
  8. 1 2 Ford, Bridget K.; Descour, Michael R.; Lynch, Ronald M. (2001-10-22). "Large-image-format computed tomography imaging spectrometer for fluorescence microscopy". Optics Express. 9 (9): 444–453. Bibcode:2001OExpr...9..444F. doi: 10.1364/oe.9.000444 . ISSN   1094-4087. PMID   19424362.
  9. Descour, Michael R.; Dereniak, Eustace L.; Dubey, Abinash C. (1995-06-20). Dubey, Abinash C; Cindrich, Ivan; Ralston, James M; Rigano, Kelly A (eds.). "<title>Mine detection using instantaneous spectral imaging</title>". SPIE Proceedings. Detection Technologies for Mines and Minelike Targets. SPIE. 2496: 286–304. Bibcode:1995SPIE.2496..286D. doi:10.1117/12.211325. S2CID   62771528.
  10. Johnson, William R.; Wilson, Daniel W.; Fink, Wolfgang; M.d, Mark S. Humayun; Bearman, Gregory H. (January 2007). "Snapshot hyperspectral imaging in ophthalmology". Journal of Biomedical Optics. 12 (1): 014036. Bibcode:2007JBO....12a4036J. doi: 10.1117/1.2434950 . ISSN   1083-3668. PMID   17343511.
  11. Hege, E. Keith; O'Connell, Dan; Johnson, William; Basty, Shridhar; Dereniak, Eustace L. (2004-01-07). Shen, Sylvia S; Lewis, Paul E (eds.). "Hyperspectral imaging for astronomy and space surveillance". Imaging Spectrometry IX. SPIE. 5159: 380–391. doi:10.1117/12.506426. S2CID   121946613.
  12. 1 2 Descour, Michael; Dereniak, Eustace (1995-08-01). "Computed-tomography imaging spectrometer: experimental calibration and reconstruction results". Applied Optics. 34 (22): 4817–4826. Bibcode:1995ApOpt..34.4817D. doi:10.1364/ao.34.004817. ISSN   0003-6935. PMID   21052321.
  13. Shepp, L. A.; Vardi, Y. (October 1982). "Maximum Likelihood Reconstruction for Emission Tomography". IEEE Transactions on Medical Imaging. 1 (2): 113–122. doi:10.1109/TMI.1982.4307558. ISSN   0278-0062. PMID   18238264.