
An optical spectrometer is an instrument used to measure properties of light over a specific portion of the electromagnetic spectrum, typically used in spectroscopic analysis to identify materials. The variable measured is most often the irradiance of the light but could also, for instance, be the polarization state. The independent variable is usually the wavelength of the light or a closely derived physical quantity, such as the corresponding wavenumber or the photon energy, in units of measurement such as centimeters, reciprocal centimeters, or electron volts, respectively.

In optics, chromatic aberration (CA), also called chromatic distortion, color aberration, color fringing, or purple fringing, is a failure of a lens to focus all colors to the same point. It is caused by dispersion: the refractive index of the lens elements varies with the wavelength of light. The refractive index of most transparent materials decreases with increasing wavelength. Since the focal length of a lens depends on the refractive index, this variation in refractive index affects focusing. Since the focal length of the lens varies with the color of the light different colors of light are brought to focus at different distances from the lens or with different levels of magnification. Chromatic aberration manifests itself as "fringes" of color along boundaries that separate dark and bright parts of the image.

An optical prism is a transparent optical element with flat, polished surfaces that are designed to refract light. At least one surface must be angled — elements with two parallel surfaces are not prisms. The most familiar type of optical prism is the triangular prism, which has a triangular base and rectangular sides. Not all optical prisms are geometric prisms, and not all geometric prisms would count as an optical prism. Prisms can be made from any material that is transparent to the wavelengths for which they are designed. Typical materials include glass, acrylic and fluorite.
A monochromator is an optical device that transmits a mechanically selectable narrow band of wavelengths of light or other radiation chosen from a wider range of wavelengths available at the input. The name is from the Greek roots mono-, "single", and chroma, "colour", and the Latin suffix -ator, denoting an agent.
A spectroradiometer is a light measurement tool that is able to measure both the wavelength and amplitude of the light emitted from a light source. Spectrometers discriminate the wavelength based on the position the light hits at the detector array allowing the full spectrum to be obtained with a single acquisition. Most spectrometers have a base measurement of counts which is the un-calibrated reading and is thus impacted by the sensitivity of the detector to each wavelength. By applying a calibration, the spectrometer is then able to provide measurements of spectral irradiance, spectral radiance and/or spectral flux. This data is also then used with built in or PC software and numerous algorithms to provide readings or Irradiance (W/cm2), Illuminance, Radiance (W/sr), Luminance (cd), Flux, Chromaticity, Color Temperature, Peak and Dominant Wavelength. Some more complex spectrometer software packages also allow calculation of PAR μmol/m2/s, Metamerism, and candela calculations based on distance and include features like 2- and 20-degree observer, baseline overlay comparisons, transmission and reflectance.
Spectral imaging is imaging that uses multiple bands across the electromagnetic spectrum. While an ordinary camera captures light across three wavelength bands in the visible spectrum, red, green, and blue (RGB), spectral imaging encompasses a wide variety of techniques that go beyond RGB. Spectral imaging may use the infrared, the visible spectrum, the ultraviolet, x-rays, or some combination of the above. It may include the acquisition of image data in visible and non-visible bands simultaneously, illumination from outside the visible range, or the use of optical filters to capture a specific spectral range. It is also possible to capture hundreds of wavelength bands for each pixel in an image.
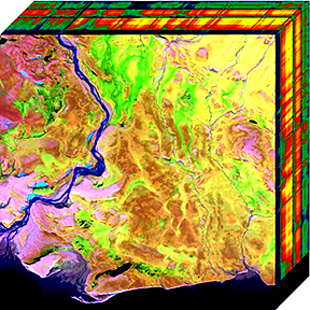
Hyperspectral imaging collects and processes information from across the electromagnetic spectrum. The goal of hyperspectral imaging is to obtain the spectrum for each pixel in the image of a scene, with the purpose of finding objects, identifying materials, or detecting processes. There are three general types of spectral imagers. There are push broom scanners and the related whisk broom scanners, which read images over time, band sequential scanners, which acquire images of an area at different wavelengths, and snapshot hyperspectral imagers, which uses a staring array to generate an image in an instant.

In optics, a dispersive prism is an optical prism that is used to disperse light, that is, to separate light into its spectral components. Different wavelengths (colors) of light will be deflected by the prism at different angles. This is a result of the prism material's index of refraction varying with wavelength (dispersion). Generally, longer wavelengths (red) undergo a smaller deviation than shorter wavelengths (blue). The dispersion of white light into colors by a prism led Sir Isaac Newton to conclude that white light consisted of a mixture of different colors.
Chemical imaging is the analytical capability to create a visual image of components distribution from simultaneous measurement of spectra and spatial, time information. Hyperspectral imaging measures contiguous spectral bands, as opposed to multispectral imaging which measures spaced spectral bands.

The Extreme Ultraviolet Explorer was a NASA space telescope for ultraviolet astronomy. EUVE was a part of NASA's Explorer spacecraft series. Launched on 7 June 1992. With instruments for ultraviolet (UV) radiation between wavelengths of 7 and 76 nm, the EUVE was the first satellite mission especially for the short-wave ultraviolet range. The satellite compiled an all-sky survey of 801 astronomical targets before being decommissioned on 31 January 2001.

Fourier-transform infrared spectroscopy (FTIR) is a technique used to obtain an infrared spectrum of absorption or emission of a solid, liquid, or gas. An FTIR spectrometer simultaneously collects high-resolution spectral data over a wide spectral range. This confers a significant advantage over a dispersive spectrometer, which measures intensity over a narrow range of wavelengths at a time.

Integral field spectrographs (IFS) combine spectrographic and imaging capabilities in the optical or infrared wavelength domains (0.32 μm – 24 μm) to get from a single exposure spatially resolved spectra in a bi-dimensional region. The name originates from the fact that the measurements result from integrating the light on multiple sub-regions of the field. Developed at first for the study of astronomical objects, this technique is now also used in many other fields, such bio-medical science and Earth remote sensing. Integral field spectrography is part of the broader category of snapshot hyperspectral imaging techniques, itself a part of hyperspectral imaging.
Multispectral remote sensing is the collection and analysis of reflected, emitted, or back-scattered energy from an object or an area of interest in multiple bands of regions of the electromagnetic spectrum. Subcategories of multispectral remote sensing include hyperspectral, in which hundreds of bands are collected and analyzed, and ultraspectral remote sensing where many hundreds of bands are used. The main purpose of multispectral imaging is the potential to classify the image using multispectral classification. This is a much faster method of image analysis than is possible by human interpretation.

Snapshot hyperspectral imaging is a method for capturing hyperspectral images during a single integration time of a detector array. No scanning is involved with this method, in contrast to push broom and whisk broom scanning techniques. The lack of moving parts means that motion artifacts should be avoided. This instrument typically features detector arrays with a high number of pixels.
PRISMA is an Italian Space Agency pre-operational and technology demonstrator mission focused on the development and delivery of hyperspectral products and the qualification of the hyperspectral payload in space.
The Venus Spectral Rocket Experiment (VeSpR) was a suborbital rocket telescope that collected data on the ultraviolet (UV) light that is being emitted from Venus's atmosphere, which can provide information about the history of water on Venus. Measurements of this type cannot be done using Earth-based telescopes because Earth's atmosphere absorbs most UV light before it reaches the ground.
Spatio-spectral scanning is one of four techniques for hyperspectral imaging, the other three being spatial scanning, spectral scanning and non-scanning, or snapshot hyperspectral imaging.

A spectrometer is a scientific instrument used to separate and measure spectral components of a physical phenomenon. Spectrometer is a broad term often used to describe instruments that measure a continuous variable of a phenomenon where the spectral components are somehow mixed. In visible light a spectrometer can separate white light and measure individual narrow bands of color, called a spectrum. A mass spectrometer measures the spectrum of the masses of the atoms or molecules present in a gas. The first spectrometers were used to split light into an array of separate colors. Spectrometers were developed in early studies of physics, astronomy, and chemistry. The capability of spectroscopy to determine chemical composition drove its advancement and continues to be one of its primary uses. Spectrometers are used in astronomy to analyze the chemical composition of stars and planets, and spectrometers gather data on the origin of the universe.
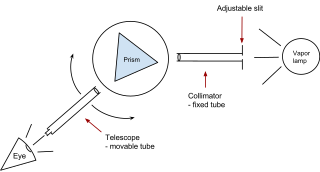
A prism spectrometer is an optical spectrometer which uses a dispersive prism as its dispersive element. The prism refracts light into its different colors (wavelengths). The dispersion occurs because the angle of refraction is dependent on the refractive index of the prism's material, which in turn is slightly dependent on the wavelength of light that is traveling through it.

Remote sensing is used in the geological sciences as a data acquisition method complementary to field observation, because it allows mapping of geological characteristics of regions without physical contact with the areas being explored. About one-fourth of the Earth's total surface area is exposed land where information is ready to be extracted from detailed earth observation via remote sensing. Remote sensing is conducted via detection of electromagnetic radiation by sensors. The radiation can be naturally sourced, or produced by machines and reflected off of the Earth surface. The electromagnetic radiation acts as an information carrier for two main variables. First, the intensities of reflectance at different wavelengths are detected, and plotted on a spectral reflectance curve. This spectral fingerprint is governed by the physio-chemical properties of the surface of the target object and therefore helps mineral identification and hence geological mapping, for example by hyperspectral imaging. Second, the two-way travel time of radiation from and back to the sensor can calculate the distance in active remote sensing systems, for example, Interferometric synthetic-aperture radar. This helps geomorphological studies of ground motion, and thus can illuminate deformations associated with landslides, earthquakes, etc.


