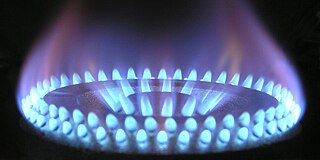
Natural gas is a naturally occurring mixture of gaseous hydrocarbons consisting primarily of methane (97%) in addition to various smaller amounts of other higher alkanes. Low levels of trace gases like carbon dioxide, nitrogen, hydrogen sulfide, and helium are also usually present. Methane is colorless and odorless, and the second largest greenhouse gas contributor to global climate change after carbon dioxide. Because natural gas is odorless, odorizers such as mercaptan are commonly added to it for safety so that leaks can be readily detected.
An energy crisis or energy shortage is any significant bottleneck in the supply of energy resources to an economy. In literature, it often refers to one of the energy sources used at a certain time and place, in particular, those that supply national electricity grids or those used as fuel in industrial development. Population growth has led to a surge in the global demand for energy in recent years. In the 2000s, this new demand – together with Middle East tension, the falling value of the US dollar, dwindling oil reserves, concerns over peak oil, and oil price speculation – triggered the 2000s energy crisis, which saw the price of oil reach an all-time high of $147.30 per barrel ($926/m3) in 2008.

The Hubbert peak theory says that for any given geographical area, from an individual oil-producing region to the planet as a whole, the rate of petroleum production tends to follow a bell-shaped curve. It is one of the primary theories on peak oil.

Liquefied natural gas (LNG) is natural gas (predominantly methane, CH4, with some mixture of ethane, C2H6) that has been cooled down to liquid form for ease and safety of non-pressurized storage or transport. It takes up about 1/600th the volume of natural gas in the gaseous state at standard conditions for temperature and pressure.

Peak oil is the theorized point in time when the maximum rate of global oil production will occur, after which oil production will begin an irreversible decline. The primary concern of peak oil is that global transportation heavily relies upon the use of gasoline and diesel fuel. Switching transportation to electric vehicles, biofuels, or more fuel-efficient forms of travel may help reduce oil demand.

From the mid-1980s to September 2003, the inflation-adjusted price of a barrel of crude oil on NYMEX was generally under US$25/barrel in 2008 dollars. During 2003, the price rose above $30, reached $60 by 11 August 2005, and peaked at $147.30 in July 2008. Commentators attributed these price increases to many factors, including Middle East tension, soaring demand from China, the falling value of the U.S. dollar, reports showing a decline in petroleum reserves, worries over peak oil, and financial speculation.
The Argentine energy crisis was a natural gas supply shortage experienced by Argentina in 2004. After the recession triggered by the Argentine economic crisis (1999-2002), Argentina's energy demands grew quickly as industry recovered, but extraction and transportation of natural gas, a cheap and relatively abundant fossil fuel, did not match the surge.

The energy industry is the totality of all of the industries involved in the production and sale of energy, including fuel extraction, manufacturing, refining and distribution. Modern society consumes large amounts of fuel, and the energy industry is a crucial part of the infrastructure and maintenance of society in almost all countries.
In economics, tax incidence or tax burden is the effect of a particular tax on the distribution of economic welfare. Economists distinguish between the entities who ultimately bear the tax burden and those on whom the tax is initially imposed. The tax burden measures the true economic effect of the tax, measured by the difference between real incomes or utilities before and after imposing the tax, and taking into account how the tax causes prices to change. For example, if a 10% tax is imposed on sellers of butter, but the market price rises 8% as a result, most of the tax burden is on buyers, not sellers. The concept of tax incidence was initially brought to economists' attention by the French Physiocrats, in particular François Quesnay, who argued that the incidence of all taxation falls ultimately on landowners and is at the expense of land rent. Tax incidence is said to "fall" upon the group that ultimately bears the burden of, or ultimately suffers a loss from, the tax. The key concept of tax incidence is that the tax incidence or tax burden does not depend on where the revenue is collected, but on the price elasticity of demand and price elasticity of supply. As a general policy matter, the tax incidence should not violate the principles of a desirable tax system, especially fairness and transparency. The concept of tax incidence is used in political science and sociology to analyze the level of resources extracted from each income social stratum in order to describe how the tax burden is distributed among social classes. That allows one to derive some inferences about the progressive nature of the tax system, according to principles of vertical equity.
In economics, demand is the quantity of a good that consumers are willing and able to purchase at various prices during a given time. The relationship between price and quantity demand is also called the demand curve. Demand for a specific item is a function of an item's perceived necessity, price, perceived quality, convenience, available alternatives, purchasers' disposable income and tastes, and many other options.

Natural gas prices, as with other commodity prices, are mainly driven by supply and demand fundamentals. However, natural gas prices may also be linked to the price of crude oil and petroleum products, especially in continental Europe. Natural gas prices in the US had historically followed oil prices, but in the recent years, it has decoupled from oil and is now trending somewhat with coal prices.

The price of oil, or the oil price, generally refers to the spot price of a barrel of benchmark crude oil—a reference price for buyers and sellers of crude oil such as West Texas Intermediate (WTI), Brent Crude, Dubai Crude, OPEC Reference Basket, Tapis crude, Bonny Light, Urals oil, Isthmus, and Western Canadian Select (WCS). Oil prices are determined by global supply and demand, rather than any country's domestic production level.

The usage and pricing of gasoline results from factors such as crude oil prices, processing and distribution costs, local demand, the strength of local currencies, local taxation, and the availability of local sources of gasoline (supply). Since fuels are traded worldwide, the trade prices are similar. The price paid by consumers largely reflects national pricing policy. Most countries impose taxes on gasoline (petrol), which causes air pollution and climate change; whereas a few, such as Venezuela, subsidize the cost. Some country's taxes do not cover all the negative externalities, that is they do not make the polluter pay the full cost. Western countries have among the highest usage rates per person. The largest consumer is the United States.
The energy policy of India is to increase the locally produced energy in India and reduce energy poverty, with more focus on developing alternative sources of energy, particularly nuclear, solar and wind energy. Net energy import dependency was 40.9% in 2021-22.
Hydrocarbon economy is a term referencing the global hydrocarbon industry and its relationship to world markets. Energy used mostly comes from three hydrocarbons: petroleum, coal, and natural gas. Hydrocarbon economy is often used when talking about possible alternatives like the hydrogen economy.

The Japan Crude Cocktail (JCC) is the informal nickname given to the pricing index of Crude Oil used in most East Asian countries. The JCC is the average price of customs-cleared crude oil imports into Japan and is published by the Petroleum Association of Japan. The official name of the JCC is the Japan Customs-cleared Crude Oil Price. The valuation of the JCC closely reflects the market state of supply and demand. Clear fluctuations in JCC pricing can be linked to distinct events such as the 2007-08 Global Financial Crisis and the 2011 Fukushima Disaster.

Food versus fuel is the dilemma regarding the risk of diverting farmland or crops for biofuels production to the detriment of the food supply. The biofuel and food price debate involves wide-ranging views, and is a long-standing, controversial one in the literature. There is disagreement about the significance of the issue, what is causing it, and what can or should be done to remedy the situation. This complexity and uncertainty is due to the large number of impacts and feedback loops that can positively or negatively affect the price system. Moreover, the relative strengths of these positive and negative impacts vary in the short and long terms, and involve delayed effects. The academic side of the debate is also blurred by the use of different economic models and competing forms of statistical analysis.
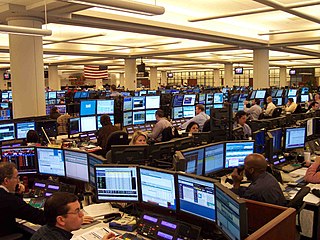
An energy market is a type of commodity market on which electricity, heat, and fuel products are traded. Natural gas and electricity are examples of products traded on an energy market. Other energy commodities include: oil, coal, carbon emissions, nuclear power, solar energy and wind energy. Due to the difficulty in storing and transporting energy, current and future prices in energy are rarely linked. This is because energy purchased at a current price is difficult to store and then sell at a later date. There are two types of market schemes : spot market and forward market.

Petroleum has been a major industry in the United States since shortly after the oil discovery in the Oil Creek area of Titusville, Pennsylvania, in 1859. The industry includes exploration, production, processing (refining), transportation, and marketing of natural gas and petroleum products. In 2018, the U.S. became the world's largest crude oil producer, producing 15% of global crude oil, surpassing Russia and Saudi Arabia. The leading oil-producing area in the United States in 2019 was Texas, followed by the offshore federal zone of the Gulf of Mexico, North Dakota and New Mexico. In 2020, the top five U.S. oil-producing states were Texas (43%), North Dakota (10.4%), New Mexico (9.2%), Oklahoma (4.1%), and Colorado (4.0%).
The 2020s commodities boom refers to the rise of many commodity prices in the early 2020s following the COVID-19 pandemic. The COVID-19 recession initially made commodity prices drop, but lockdowns, supply chain bottlenecks, and dovish monetary policy limited supply and created excess demand causing a commodity super cycle rise.


