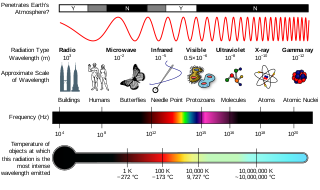
The electromagnetic spectrum is the full range of electromagnetic radiation, organized by frequency or wavelength. The spectrum is divided into separate bands, with different names for the electromagnetic waves within each band. From low to high frequency these are: radio waves, microwaves, infrared, visible light, ultraviolet, X-rays, and gamma rays. The electromagnetic waves in each of these bands have different characteristics, such as how they are produced, how they interact with matter, and their practical applications.

The ozone layer or ozone shield is a region of Earth's stratosphere that absorbs most of the Sun's ultraviolet radiation. It contains a high concentration of ozone (O3) in relation to other parts of the atmosphere, although still small in relation to other gases in the stratosphere. The ozone layer contains less than 10 parts per million of ozone, while the average ozone concentration in Earth's atmosphere as a whole is about 0.3 parts per million. The ozone layer is mainly found in the lower portion of the stratosphere, from approximately 15 to 35 kilometers (9 to 22 mi) above Earth, although its thickness varies seasonally and geographically.

An optical spectrometer is an instrument used to measure properties of light over a specific portion of the electromagnetic spectrum, typically used in spectroscopic analysis to identify materials. The variable measured is most often the irradiance of the light but could also, for instance, be the polarization state. The independent variable is usually the wavelength of the light or a closely derived physical quantity, such as the corresponding wavenumber or the photon energy, in units of measurement such as centimeters, reciprocal centimeters, or electron volts, respectively.

Ultraviolet (UV) light is electromagnetic radiation of wavelengths of 10–400 nanometers, shorter than that of visible light, but longer than X-rays. UV radiation is present in sunlight, and constitutes about 10% of the total electromagnetic radiation output from the Sun. It is also produced by electric arcs, Cherenkov radiation, and specialized lights, such as mercury-vapor lamps, tanning lamps, and black lights.

Ozone depletion consists of two related events observed since the late 1970s: a steady lowering of about four percent in the total amount of ozone in Earth's atmosphere, and a much larger springtime decrease in stratospheric ozone around Earth's polar regions. The latter phenomenon is referred to as the ozone hole. There are also springtime polar tropospheric ozone depletion events in addition to these stratospheric events.
Fourier-transform spectroscopy is a measurement technique whereby spectra are collected based on measurements of the coherence of a radiative source, using time-domain or space-domain measurements of the radiation, electromagnetic or not. It can be applied to a variety of types of spectroscopy including optical spectroscopy, infrared spectroscopy, nuclear magnetic resonance (NMR) and magnetic resonance spectroscopic imaging (MRSI), mass spectrometry and electron spin resonance spectroscopy.
Ultraviolet (UV) spectroscopy or ultraviolet–visible (UV–VIS) spectrophotometry refers to absorption spectroscopy or reflectance spectroscopy in part of the ultraviolet and the full, adjacent visible regions of the electromagnetic spectrum. Being relatively inexpensive and easily implemented, this methodology is widely used in diverse applied and fundamental applications. The only requirement is that the sample absorb in the UV-Vis region, i.e. be a chromophore. Absorption spectroscopy is complementary to fluorescence spectroscopy. Parameters of interest, besides the wavelength of measurement, are absorbance (A) or transmittance (%T) or reflectance (%R), and its change with time.

A blacklight, also called a UV-A light, Wood's lamp, or ultraviolet light, is a lamp that emits long-wave (UV-A) ultraviolet light and very little visible light. One type of lamp has a violet filter material, either on the bulb or in a separate glass filter in the lamp housing, which blocks most visible light and allows through UV, so the lamp has a dim violet glow when operating. Blacklight lamps which have this filter have a lighting industry designation that includes the letters "BLB". This stands for "blacklight blue". A second type of lamp produces ultraviolet but does not have the filter material, so it produces more visible light and has a blue color when operating. These tubes are made for use in "bug zapper" insect traps, and are identified by the industry designation "BL". This stands for "blacklight".

Spectrophotometry is a branch of electromagnetic spectroscopy concerned with the quantitative measurement of the reflection or transmission properties of a material as a function of wavelength. Spectrophotometry uses photometers, known as spectrophotometers, that can measure the intensity of a light beam at different wavelengths. Although spectrophotometry is most commonly applied to ultraviolet, visible, and infrared radiation, modern spectrophotometers can interrogate wide swaths of the electromagnetic spectrum, including x-ray, ultraviolet, visible, infrared, and/or microwave wavelengths.
A monochromator is an optical device that transmits a mechanically selectable narrow band of wavelengths of light or other radiation chosen from a wider range of wavelengths available at the input. The name is from Greek mono- 'single' chroma 'colour' and Latin -ator 'denoting an agent'.
SCISAT-1 is a Canadian satellite designed to make observations of the Earth's atmosphere. Its main instruments are an optical Fourier transform infrared spectrometer, the ACE-FTS Instrument, and an ultraviolet spectrophotometer, MAESTRO. These devices record spectra of the Sun, as sunlight passes through the Earth's atmosphere, making analyses of the chemical elements of the atmosphere possible.

The Upper Atmosphere Research Satellite (UARS) was a NASA-operated orbital observatory whose mission was to study the Earth's atmosphere, particularly the protective ozone layer. The 5,900-kilogram (13,000 lb) satellite was deployed from Space Shuttle Discovery during the STS-48 mission on 15 September 1991. It entered Earth orbit at an operational altitude of 600 kilometers (370 mi), with an orbital inclination of 57 degrees.
The Scientific Assessment of Ozone Depletion is a sequence of reports sponsored by WMO/UNEP. The most recent report is from 2018. The reports were set up to inform the Montreal Protocol and amendments about ozone depletion.
A spectroradiometer is a light measurement tool that is able to measure both the wavelength and amplitude of the light emitted from a light source. Spectrometers discriminate the wavelength based on the position the light hits at the detector array allowing the full spectrum to be obtained with a single acquisition. Most spectrometers have a base measurement of counts which is the un-calibrated reading and is thus impacted by the sensitivity of the detector to each wavelength. By applying a calibration, the spectrometer is then able to provide measurements of spectral irradiance, spectral radiance and/or spectral flux. This data is also then used with built in or PC software and numerous algorithms to provide readings or Irradiance (W/cm2), Illuminance, Radiance (W/sr), Luminance (cd), Flux, Chromaticity, Color Temperature, Peak and Dominant Wavelength. Some more complex spectrometer software packages also allow calculation of PAR μmol/m2/s, Metamerism, and candela calculations based on distance and include features like 2- and 20-degree observer, baseline overlay comparisons, transmission and reflectance.

The Physical Research Laboratory is a National Research Institute for space and allied sciences, supported mainly by Department of Space, Government of India. This research laboratory has ongoing research programmes in astronomy and astrophysics, atmospheric sciences and aeronomy, planetary and geosciences, Earth sciences, Solar System studies and theoretical physics. It also manages the Udaipur Solar Observatory and Mount Abu InfraRed Observatory. The PRL is located in Ahmedabad.

The Solar Backscatter Ultraviolet Radiometer, or SBUV/2, is a series of operational remote sensors on NOAA weather satellites in Sun-synchronous orbits which have been providing global measurements of stratospheric total ozone, as well as ozone profiles, since March 1985. The SBUV/2 instruments were developed from the SBUV experiment flown on the Nimbus-7 spacecraft which improved on the design of the original BUV instrument on Nimbus-4. These are nadir viewing radiometric instruments operating at mid to near UV wavelengths. SBUV/2 data sets overlap with data from SBUV and TOMS instruments on the Nimbus-7 spacecraft. These extensive data sets measure the density and vertical distribution of ozone in the Earth's atmosphere from six to 30 miles.

Fourier-transform infrared spectroscopy (FTIR) is a technique used to obtain an infrared spectrum of absorption or emission of a solid, liquid, or gas. An FTIR spectrometer simultaneously collects high-resolution spectral data over a wide spectral range. This confers a significant advantage over a dispersive spectrometer, which measures intensity over a narrow range of wavelengths at a time.

Sunburn is a form of radiation burn that affects living tissue, such as skin, that results from an overexposure to ultraviolet (UV) radiation, usually from the Sun. Common symptoms in humans and other animals include red or reddish skin that is hot to the touch or painful, general fatigue, and mild dizziness. Other symptoms include blistering, peeling skin, swelling, itching, and nausea. Excessive UV radiation is the leading cause of (primarily) non-malignant skin tumors, which in extreme cases can be life-threatening. Sunburn is an inflammatory response in the tissue triggered by direct DNA damage by UV radiation. When the cells' DNA is overly damaged by UV radiation, type I cell-death is triggered and the tissue is replaced.
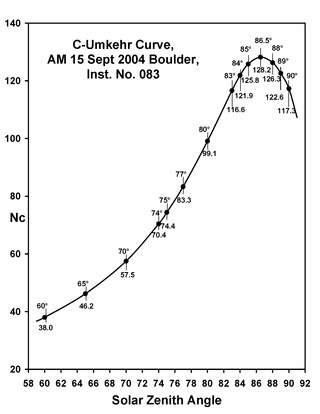
In solid state physics, the Umkehr (meaning 'reversal', German pronunciation:[ˈʊmˌkeːʁ], from German um 'around' and kehr 'turn') is the time variation of the ratio of the scattered intensity at two different wavelengths. The Umkehr effect is observed when measurements are made with ultraviolet spectrophotometer of the ratio of the zenith sky light intensities of two wavelengths in the solar ultraviolet when the sun is near the horizon. The shorter of two wavelengths (intensity I) is strongly absorbed and the other (intensity I' ) is weakly absorbed. If the value of log(I/I' ) is plotted against the sun's zenith angle, it is observed that this log-intensity ratio decreases as the zenith angle increases until a minimum is reached for a zenith angle of about 8° (when the wavelengths are 3114 and 3324 A).
Explorer 55, also known as AE-E, was a NASA scientific satellite belonging to the Atmosphere Explorer series launched on 20 November 1975 from Cape Canaveral Air Force Station (CCAFS) aboard a Thor-Delta 2910 launch vehicle.

