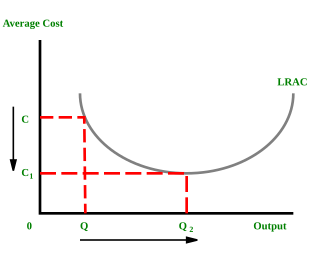
In microeconomics, economies of scale are the cost advantages that enterprises obtain due to their scale of operation, and are typically measured by the amount of output produced per unit of cost. A decrease in cost per unit of output enables an increase in scale that is, increased production with lowered cost. At the basis of economies of scale, there may be technical, statistical, organizational or related factors to the degree of market control.
Microeconomics is a branch of economics that studies the behavior of individuals and firms in making decisions regarding the allocation of scarce resources and the interactions among these individuals and firms. Microeconomics focuses on the study of individual markets, sectors, or industries as opposed to the economy as a whole, which is studied in macroeconomics.

In economics, an indifference curve connects points on a graph representing different quantities of two goods, points between which a consumer is indifferent. That is, any combinations of two products indicated by the curve will provide the consumer with equal levels of utility, and the consumer has no preference for one combination or bundle of goods over a different combination on the same curve. One can also refer to each point on the indifference curve as rendering the same level of utility (satisfaction) for the consumer. In other words, an indifference curve is the locus of various points showing different combinations of two goods providing equal utility to the consumer. Utility is then a device to represent preferences rather than something from which preferences come. The main use of indifference curves is in the representation of potentially observable demand patterns for individual consumers over commodity bundles.

In economics, profit maximization is the short run or long run process by which a firm may determine the price, input and output levels that will lead to the highest possible total profit. In neoclassical economics, which is currently the mainstream approach to microeconomics, the firm is assumed to be a "rational agent" which wants to maximize its total profit, which is the difference between its total revenue and its total cost.
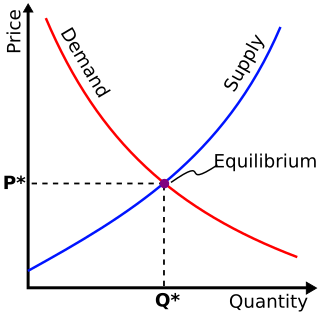
In economics, elasticity measures the responsiveness of one economic variable to a change in another. For example, if the price elasticity of the demand of a good is −2, then a 10% increase in price will cause the quantity demanded to fall by 20%. Elasticity in economics provides an understanding of changes in the behavior of the buyers and sellers with price changes. There are two types of elasticity for demand and supply, one is inelastic demand and supply and the other one is elastic demand and supply.
The following outline is provided as an overview of and topical guide to industrial organization:
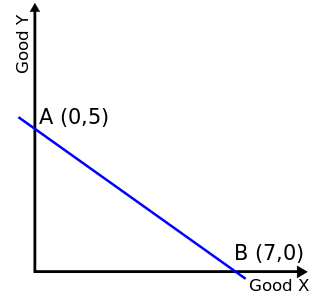
In economics, a budget constraint represents all the combinations of goods and services that a consumer may purchase given current prices within their given income. Consumer theory uses the concepts of a budget constraint and a preference map as tools to examine the parameters of consumer choices. Both concepts have a ready graphical representation in the two-good case. The consumer can only purchase as much as their income will allow, hence they are constrained by their budget. The equation of a budget constraint is where is the price of good X, and is the price of good Y, and m is income.
In economics, the marginal cost is the change in the total cost that arises when the quantity produced is increased, i.e. the cost of producing additional quantity. In some contexts, it refers to an increment of one unit of output, and in others it refers to the rate of change of total cost as output is increased by an infinitesimal amount. As Figure 1 shows, the marginal cost is measured in dollars per unit, whereas total cost is in dollars, and the marginal cost is the slope of the total cost, the rate at which it increases with output. Marginal cost is different from average cost, which is the total cost divided by the number of units produced.
In microeconomics, a production–possibility frontier (PPF), production possibility curve (PPC), or production possibility boundary (PPB) is a graphical representation showing all the possible options of output for two that can be produced using all factors of production, where the given resources are fully and efficiently utilized per unit time. A PPF illustrates several economic concepts, such as allocative efficiency, economies of scale, opportunity cost, productive efficiency, and scarcity of resources.

In economics, a production function gives the technological relation between quantities of physical inputs and quantities of output of goods. The production function is one of the key concepts of mainstream neoclassical theories, used to define marginal product and to distinguish allocative efficiency, a key focus of economics. One important purpose of the production function is to address allocative efficiency in the use of factor inputs in production and the resulting distribution of income to those factors, while abstracting away from the technological problems of achieving technical efficiency, as an engineer or professional manager might understand it.
Managerial economics is a branch of economics involving the application of economic methods in the organizational decision-making process. Economics is the study of the production, distribution, and consumption of goods and services. Managerial economics involves the use of economic theories and principles to make decisions regarding the allocation of scarce resources. It guides managers in making decisions relating to the company's customers, competitors, suppliers, and internal operations.
In economics, average cost (AC) or unit cost is equal to total cost (TC) divided by the number of units of a good produced :
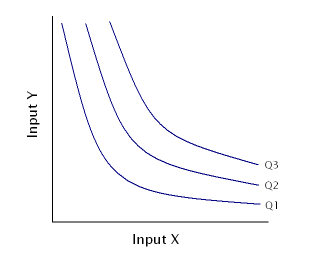
An isoquant, in microeconomics, is a contour line drawn through the set of points at which the same quantity of output is produced while changing the quantities of two or more inputs. The x and y axis on an isoquant represent two relevant inputs, which are usually a factor of production such as labour, capital, land, or organisation. An isoquant may also be known as an "iso-product curve", or an "equal product curve".

In economics, an isocost line shows all combinations of inputs which cost the same total amount. Although similar to the budget constraint in consumer theory, the use of the isocost line pertains to cost-minimization in production, as opposed to utility-maximization. For the two production inputs labour and capital, with fixed unit costs of the inputs, the equation of the isocost line is
In geometry and science, a cross section is the non-empty intersection of a solid body in three-dimensional space with a plane, or the analog in higher-dimensional spaces. Cutting an object into slices creates many parallel cross-sections. The boundary of a cross-section in three-dimensional space that is parallel to two of the axes, that is, parallel to the plane determined by these axes, is sometimes referred to as a contour line; for example, if a plane cuts through mountains of a raised-relief map parallel to the ground, the result is a contour line in two-dimensional space showing points on the surface of the mountains of equal elevation.
In economics, a cost curve is a graph of the costs of production as a function of total quantity produced. In a free market economy, productively efficient firms optimize their production process by minimizing cost consistent with each possible level of production, and the result is a cost curve. Profit-maximizing firms use cost curves to decide output quantities. There are various types of cost curves, all related to each other, including total and average cost curves; marginal cost curves, which are equal to the differential of the total cost curves; and variable cost curves. Some are applicable to the short run, others to the long run.
In economics, a conditional factor demand is the cost-minimizing level of an input such as labor or capital, required to produce a given level of output, for given unit input costs of the input factors. A conditional factor demand function expresses the conditional factor demand as a function of the output level and the input costs. The conditional portion of this phrase refers to the fact that this function is conditional on a given level of output, so output is one argument of the function. Typically this concept arises in a long run context in which both labor and capital usage are choosable by the firm, so a single optimization gives rise to conditional factor demands for each of labor and capital.
In economics, the long-run is a theoretical concept in which all markets are in equilibrium, and all prices and quantities have fully adjusted and are in equilibrium. The long-run contrasts with the short-run, in which there are some constraints and markets are not fully in equilibrium. More specifically, in microeconomics there are no fixed factors of production in the long-run, and there is enough time for adjustment so that there are no constraints preventing changing the output level by changing the capital stock or by entering or leaving an industry. This contrasts with the short-run, where some factors are variable and others are fixed, constraining entry or exit from an industry. In macroeconomics, the long-run is the period when the general price level, contractual wage rates, and expectations adjust fully to the state of the economy, in contrast to the short-run when these variables may not fully adjust.
In economics, the marginal product of labor (MPL) is the change in output that results from employing an added unit of labor. It is a feature of the production function and depends on the amounts of physical capital and labor already in use.
In economics and microeconomics, the economic region of production is an offshoot of the theory of production function with two variables. It is a cost-oriented theory which defines the region in which the optimal factor combination will lie. It serves as a map of the region of optimal production. Economic region of production consist of negatively sloped portion of all isoquants.
