Safety engineering is an engineering discipline which assures that engineered systems provide acceptable levels of safety. It is strongly related to industrial engineering/systems engineering, and the subset system safety engineering. Safety engineering assures that a life-critical system behaves as needed, even when components fail.
Monte Carlo methods, or Monte Carlo experiments, are a broad class of computational algorithms that rely on repeated random sampling to obtain numerical results. The underlying concept is to use randomness to solve problems that might be deterministic in principle. They are often used in physical and mathematical problems and are most useful when it is difficult or impossible to use other approaches. Monte Carlo methods are mainly used in three problem classes: optimization, numerical integration, and generating draws from a probability distribution.

Fault tree analysis (FTA) is a type of failure analysis in which an undesired state of a system is examined. This analysis method is mainly used in safety engineering and reliability engineering to understand how systems can fail, to identify the best ways to reduce risk and to determine event rates of a safety accident or a particular system level (functional) failure. FTA is used in the aerospace, nuclear power, chemical and process, pharmaceutical, petrochemical and other high-hazard industries; but is also used in fields as diverse as risk factor identification relating to social service system failure. FTA is also used in software engineering for debugging purposes and is closely related to cause-elimination technique used to detect bugs.
A randomized algorithm is an algorithm that employs a degree of randomness as part of its logic or procedure. The algorithm typically uses uniformly random bits as an auxiliary input to guide its behavior, in the hope of achieving good performance in the "average case" over all possible choices of random determined by the random bits; thus either the running time, or the output are random variables.
Multi-disciplinary design optimization (MDO) is a field of engineering that uses optimization methods to solve design problems incorporating a number of disciplines. It is also known as multidisciplinary system design optimization (MSDO), and Multidisciplinary Design Analysis and Optimization (MDAO).
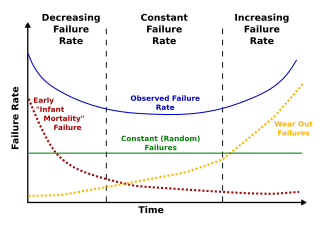
Failure rate is the frequency with which an engineered system or component fails, expressed in failures per unit of time. It is usually denoted by the Greek letter λ (lambda) and is often used in reliability engineering.
Reliability engineering is a sub-discipline of systems engineering that emphasizes the ability of equipment to function without failure. Reliability describes the ability of a system or component to function under stated conditions for a specified period of time. Reliability is closely related to availability, which is typically described as the ability of a component or system to function at a specified moment or interval of time.
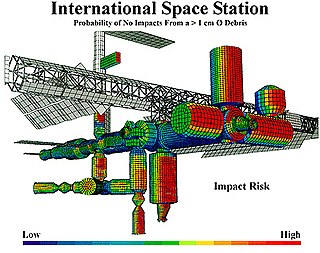
Probabilistic risk assessment (PRA) is a systematic and comprehensive methodology to evaluate risks associated with a complex engineered technological entity or the effects of stressors on the environment.
Uncertainty quantification (UQ) is the science of quantitative characterization and reduction of uncertainties in both computational and real world applications. It tries to determine how likely certain outcomes are if some aspects of the system are not exactly known. An example would be to predict the acceleration of a human body in a head-on crash with another car: even if the speed was exactly known, small differences in the manufacturing of individual cars, how tightly every bolt has been tightened, etc., will lead to different results that can only be predicted in a statistical sense.
Probabilistic design is a discipline within engineering design. It deals primarily with the consideration of the effects of random variability upon the performance of an engineering system during the design phase. Typically, these effects are related to quality and reliability. Thus, probabilistic design is a tool that is mostly used in areas that are concerned with quality and reliability. For example, product design, quality control, systems engineering, machine design, civil engineering and manufacturing. It differs from the classical approach to design by assuming a small probability of failure instead of using the safety factor.
When two probability distributions overlap, statistical interference exists. Knowledge of the distributions can be used to determine the likelihood that one parameter exceeds another, and by how much.
In statistics, censoring is a condition in which the value of a measurement or observation is only partially known.
NESSUS is a general-purpose, probabilistic analysis program that simulates variations and uncertainties in loads, geometry, material behavior and other user-defined inputs to compute probability of failure and probabilistic sensitivity measures of engineered systems. Because NESSUS uses highly efficient and accurate probabilistic analysis methods, probabilistic solutions can be obtained even for extremely large and complex models. The system performance can be hierarchically decomposed into multiple smaller models and/or analytical equations. Once the probabilistic response is quantified, the results can be used to support risk-informed decisions regarding reliability for safety critical and one-of-a-kind systems, and to maintain a level of quality while reducing manufacturing costs for larger quantity products.
OptiY is a design environment software that provides modern optimization strategies and state of the art probabilistic algorithms for uncertainty, reliability, robustness, sensitivity analysis, data-mining and meta-modeling.

A probability box is a characterization of uncertain numbers consisting of both aleatoric and epistemic uncertainties that is often used in risk analysis or quantitative uncertainty modeling where numerical calculations must be performed. Probability bounds analysis is used to make arithmetic and logical calculations with p-boxes.
Probability bounds analysis (PBA) is a collection of methods of uncertainty propagation for making qualitative and quantitative calculations in the face of uncertainties of various kinds. It is used to project partial information about random variables and other quantities through mathematical expressions. For instance, it computes sure bounds on the distribution of a sum, product, or more complex function, given only sure bounds on the distributions of the inputs. Such bounds are called probability boxes, and constrain cumulative probability distributions.
P-boxes and probability bounds analysis have been used in many applications spanning many disciplines in engineering and environmental science, including:

A cascade chart is tool that can be used in damage tolerance analysis to determine the proper inspection interval, based on reliability analysis, considering all the context uncertainties. The chart is called a "cascade chart" because the scatter of data points and downward curvature resembles a waterfall or cascade. This name was first introduced by Dr. Alberto W Mello in his work "Reliability prediction for structures under cyclic loads and recurring inspections". Materials subject to cyclic loads, as shown in the graph on the right, may form and propagate cracks over time due to fatigue. Therefore, it is essential to determine a reliable inspection interval. There are numerous factors that must be considered to determine this inspection interval. The non-destructive inspection (NDI) technique must have a high probability of detecting a crack in the material. If missed, a crack may lead the structure to a catastrophic failure before the next inspection. On the other hand, the inspection interval cannot be too frequent that the structure's maintenance is no longer profitable.
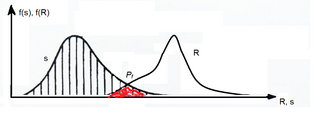
Structural reliability is about applying reliability engineering theories to buildings and, more generally, structural analysis. Reliability is also used as a probabilistic measure of structural safety. The reliability of a structure is defined as the probability of complement of failure . The failure occurs when the total applied load is larger than the total resistance of the structure. Structural reliability has become known as a design philosophy in the twenty-first century, and it might replace traditional deterministic ways of design and maintenance.
Deterioration modeling is the process of modeling and predicting the physical conditions of equipment, structures, infrastructure or any other physical assets. The condition of infrastructure is represented either using a deterministic index or the probability of failure. Examples of such performance measures are pavement condition index for roads or bridge condition index for bridges. For probabilistic measures, which are the focus of reliability theory, probability of failure or reliability index are used. Deterioration models are instrumental to infrastructure asset management and are the basis for maintenance and rehabilitation decision-making. The condition of all physical infrastructure degrade over time. A deterioration model can help decision-makers to understand how fast the condition drops or violates a certain threshold.

