Multivariate statistics is a subdivision of statistics encompassing the simultaneous observation and analysis of more than one outcome variable, i.e., multivariate random variables. Multivariate statistics concerns understanding the different aims and background of each of the different forms of multivariate analysis, and how they relate to each other. The practical application of multivariate statistics to a particular problem may involve several types of univariate and multivariate analyses in order to understand the relationships between variables and their relevance to the problem being studied.
A disassembler is a computer program that translates machine language into assembly language—the inverse operation to that of an assembler. Disassembly, the output of a disassembler, is often formatted for human-readability rather than suitability for input to an assembler, making it principally a reverse-engineering tool. Common uses of disassemblers include analyzing high-level programing language compilers output and their optimizations, recovering source code of a program whose original source was lost, malware analysis, modifying software, and software cracking.

Principal component analysis (PCA) is a popular technique for analyzing large datasets containing a high number of dimensions/features per observation, increasing the interpretability of data while preserving the maximum amount of information, and enabling the visualization of multidimensional data. Formally, PCA is a statistical technique for reducing the dimensionality of a dataset. This is accomplished by linearly transforming the data into a new coordinate system where the variation in the data can be described with fewer dimensions than the initial data. Many studies use the first two principal components in order to plot the data in two dimensions and to visually identify clusters of closely related data points. Principal component analysis has applications in many fields such as population genetics, microbiome studies, and atmospheric science.

SPSS Statistics is a statistical software suite developed by IBM for data management, advanced analytics, multivariate analysis, business intelligence, and criminal investigation. Long produced by SPSS Inc., it was acquired by IBM in 2009. Versions of the software released since 2015 have the brand name IBM SPSS Statistics.

In statistics, the standard score is the number of standard deviations by which the value of a raw score is above or below the mean value of what is being observed or measured. Raw scores above the mean have positive standard scores, while those below the mean have negative standard scores.

In statistics, Spearman's rank correlation coefficient or Spearman's ρ, named after Charles Spearman and often denoted by the Greek letter (rho) or as , is a nonparametric measure of rank correlation. It assesses how well the relationship between two variables can be described using a monotonic function.
Factor analysis is a statistical method used to describe variability among observed, correlated variables in terms of a potentially lower number of unobserved variables called factors. For example, it is possible that variations in six observed variables mainly reflect the variations in two unobserved (underlying) variables. Factor analysis searches for such joint variations in response to unobserved latent variables. The observed variables are modelled as linear combinations of the potential factors plus "error" terms, hence factor analysis can be thought of as a special case of errors-in-variables models.

In statistics, canonical-correlation analysis (CCA), also called canonical variates analysis, is a way of inferring information from cross-covariance matrices. If we have two vectors X = (X1, ..., Xn) and Y = (Y1, ..., Ym) of random variables, and there are correlations among the variables, then canonical-correlation analysis will find linear combinations of X and Y which have maximum correlation with each other. T. R. Knapp notes that "virtually all of the commonly encountered parametric tests of significance can be treated as special cases of canonical-correlation analysis, which is the general procedure for investigating the relationships between two sets of variables." The method was first introduced by Harold Hotelling in 1936, although in the context of angles between flats the mathematical concept was published by Jordan in 1875.
Analysis of covariance (ANCOVA) is a general linear model which blends ANOVA and regression. ANCOVA evaluates whether the means of a dependent variable (DV) are equal across levels of one or more categorical independent variables and across one or more continuous variables. For example, the categorical variable(s) might describe treatment and the continuous variable(s) might be covariates or nuisance variables; or vice versa. Mathematically, ANCOVA decomposes the variance in the DV into variance explained by the CV(s), variance explained by the categorical IV, and residual variance. Intuitively, ANCOVA can be thought of as 'adjusting' the DV by the group means of the CV(s).

In statistics, an interaction may arise when considering the relationship among three or more variables, and describes a situation in which the effect of one causal variable on an outcome depends on the state of a second causal variable. Although commonly thought of in terms of causal relationships, the concept of an interaction can also describe non-causal associations. Interactions are often considered in the context of regression analyses or factorial experiments.

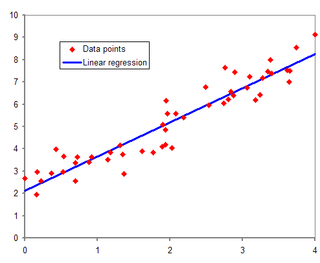
In statistical modeling, regression analysis is a set of statistical processes for estimating the relationships between a dependent variable and one or more independent variables. The most common form of regression analysis is linear regression, in which one finds the line that most closely fits the data according to a specific mathematical criterion. For example, the method of ordinary least squares computes the unique line that minimizes the sum of squared differences between the true data and that line. For specific mathematical reasons, this allows the researcher to estimate the conditional expectation of the dependent variable when the independent variables take on a given set of values. Less common forms of regression use slightly different procedures to estimate alternative location parameters or estimate the conditional expectation across a broader collection of non-linear models.
Linear discriminant analysis (LDA), normal discriminant analysis (NDA), or discriminant function analysis is a generalization of Fisher's linear discriminant, a method used in statistics and other fields, to find a linear combination of features that characterizes or separates two or more classes of objects or events. The resulting combination may be used as a linear classifier, or, more commonly, for dimensionality reduction before later classification.

Data analysis is the process of inspecting, cleansing, transforming, and modeling data with the goal of discovering useful information, informing conclusions, and supporting decision-making. Data analysis has multiple facets and approaches, encompassing diverse techniques under a variety of names, and is used in different business, science, and social science domains. In today's business world, data analysis plays a role in making decisions more scientific and helping businesses operate more effectively.

In causal inference, a confounder is a variable that influences both the dependent variable and independent variable, causing a spurious association. Confounding is a causal concept, and as such, cannot be described in terms of correlations or associations. The existence of confounders is an important quantitative explanation why correlation does not imply causation.
In statistics, the Kendall rank correlation coefficient, commonly referred to as Kendall's τ coefficient, is a statistic used to measure the ordinal association between two measured quantities. A τ test is a non-parametric hypothesis test for statistical dependence based on the τ coefficient. It is a measure of rank correlation: the similarity of the orderings of the data when ranked by each of the quantities. It is named after Maurice Kendall, who developed it in 1938, though Gustav Fechner had proposed a similar measure in the context of time series in 1897.

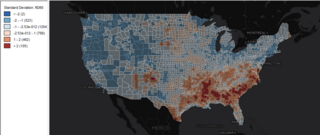
GeoDa is a free software package that conducts spatial data analysis, geovisualization, spatial autocorrelation and spatial modeling.
GGobi is a free statistical software tool for interactive data visualization. GGobi allows extensive exploration of the data with Interactive dynamic graphics. It is also a tool for looking at multivariate data. R can be used in sync with GGobi. The GGobi software can be embedded as a library in other programs and program packages using an application programming interface (API) or as an add-on to existing languages and scripting environments, e.g., with the R command line or from a Perl or Python scripts. GGobi prides itself on its ability to link multiple graphs together.
A batch file is a script file in DOS, OS/2 and Microsoft Windows. It consists of a series of commands to be executed by the command-line interpreter, stored in a plain text file. A batch file may contain any command the interpreter accepts interactively and use constructs that enable conditional branching and looping within the batch file, such as IF, FOR, and GOTO labels. The term "batch" is from batch processing, meaning "non-interactive execution", though a batch file might not process a batch of multiple data.
DADiSP is a numerical computing environment developed by DSP Development Corporation which allows one to display and manipulate data series, matrices and images with an interface similar to a spreadsheet. DADiSP is used in the study of signal processing, numerical analysis, statistical and physiological data processing.
In statistics, linear regression is a linear approach for modelling the relationship between a scalar response and one or more explanatory variables. The case of one explanatory variable is called simple linear regression; for more than one, the process is called multiple linear regression. This term is distinct from multivariate linear regression, where multiple correlated dependent variables are predicted, rather than a single scalar variable.


