Related Research Articles

In meteorology, a cyclone is a large air mass that rotates around a strong center of low atmospheric pressure, counterclockwise in the Northern Hemisphere and clockwise in the Southern Hemisphere as viewed from above. Cyclones are characterized by inward-spiraling winds that rotate about a zone of low pressure. The largest low-pressure systems are polar vortices and extratropical cyclones of the largest scale. Warm-core cyclones such as tropical cyclones and subtropical cyclones also lie within the synoptic scale. Mesocyclones, tornadoes, and dust devils lie within the smaller mesoscale.
Surface weather analysis is a special type of weather map that provides a view of weather elements over a geographical area at a specified time based on information from ground-based weather stations.

An anticyclone is a weather phenomenon defined as a large-scale circulation of winds around a central region of high atmospheric pressure, clockwise in the Northern Hemisphere and counterclockwise in the Southern Hemisphere as viewed from above. Effects of surface-based anticyclones include clearing skies as well as cooler, drier air. Fog can also form overnight within a region of higher pressure.

A squall is a sudden, sharp increase in wind speed lasting minutes, as opposed to a wind gust, which lasts for only seconds. They are usually associated with active weather, such as rain showers, thunderstorms, or heavy snow. Squalls refer to the increase of the sustained winds over that time interval, as there may be higher gusts during a squall event. They usually occur in a region of strong sinking air or cooling in the mid-atmosphere. These force strong localized upward motions at the leading edge of the region of cooling, which then enhances local downward motions just in its wake.

In meteorology, an air mass is a volume of air defined by its temperature and humidity. Air masses cover many hundreds or thousands of square miles, and adapt to the characteristics of the surface below them. They are classified according to latitude and their continental or maritime source regions. Colder air masses are termed polar or arctic, while warmer air masses are deemed tropical. Continental and superior air masses are dry, while maritime and monsoon air masses are moist. Weather fronts separate air masses with different density characteristics. Once an air mass moves away from its source region, underlying vegetation and water bodies can quickly modify its character. Classification schemes tackle an air mass's characteristics, as well as modification.
A weather map, also known as synoptic weather chart, displays various meteorological features across a particular area at a particular point in time and has various symbols which all have specific meanings. Such maps have been in use since the mid-19th century and are used for research and weather forecasting purposes. Maps using isotherms show temperature gradients, which can help locate weather fronts. Isotach maps, analyzing lines of equal wind speed, on a constant pressure surface of 300 or 250 hPa show where the jet stream is located. Use of constant pressure charts at the 700 and 500 hPa level can indicate tropical cyclone motion. Two-dimensional streamlines based on wind speeds at various levels show areas of convergence and divergence in the wind field, which are helpful in determining the location of features within the wind pattern. A popular type of surface weather map is the surface weather analysis, which plots isobars to depict areas of high pressure and low pressure. Cloud codes are translated into symbols and plotted on these maps along with other meteorological data that are included in synoptic reports sent by professionally trained observers.
A high-pressure area, high, or anticyclone, is an area near the surface of a planet where the atmospheric pressure is greater than the pressure in the surrounding regions. Highs are middle-scale meteorological features that result from interplays between the relatively larger-scale dynamics of an entire planet's atmospheric circulation.

In meteorology, the synoptic scale is a horizontal length scale of the order of 1,000 km (620 mi) or more. This corresponds to a horizontal scale typical of mid-latitude depressions. Most high- and low-pressure areas seen on weather maps are synoptic-scale systems, driven by the location of Rossby waves in their respective hemisphere. Low-pressure areas and their related frontal zones occur on the leading edge of a trough within the Rossby wave pattern, while high-pressure areas form on the back edge of the trough. Most precipitation areas occur near frontal zones. The word synoptic is derived from the Ancient Greek word συνοπτικός (sunoptikós), meaning "seen together".

The trade winds or easterlies are permanent east-to-west prevailing winds that flow in the Earth's equatorial region. The trade winds blow mainly from the northeast in the Northern Hemisphere and from the southeast in the Southern Hemisphere, strengthening during the winter and when the Arctic oscillation is in its warm phase. Trade winds have been used by captains of sailing ships to cross the world's oceans for centuries. They enabled European colonization of the Americas, and trade routes to become established across the Atlantic Ocean and the Pacific Ocean.
A stationary front is a weather front or transition zone between two air masses when each air mass is advancing into the other at speeds less than 5 knots at the ground surface. On weather maps, it is illustrated as a solid line of alternating blue spikes pointing to the warmer air mass and red domes facing the colder air mass.
Professor Sir Brian John Hoskins, CBE FRS, is a British dynamical meteorologist and climatologist based at the Imperial College London and the University of Reading. He is a recipient of the 2024 Japan Prize along with Professor John Michael Wallace in the field of "Resources, Energy, the Environment, and Social Infrastructure" for "Establishment of a scientific foundation for understanding and predicting extreme weather events". He is a mathematician by training, his research has focused on understanding atmospheric motion from the scale of fronts to that of the Earth, using a range of theoretical and numerical models. He is perhaps best known for his work on the mathematical theory of extratropical cyclones and frontogenesis, particularly through the use of potential vorticity. He has also produced research across many areas of meteorology, including the Indian monsoon and global warming, recently contributing to the Stern review and the IPCC Fourth Assessment Report.
This is a list of meteorology topics. The terms relate to meteorology, the interdisciplinary scientific study of the atmosphere that focuses on weather processes and forecasting.

A weather front is a boundary separating air masses for which several characteristics differ, such as air density, wind, temperature, and humidity. Disturbed and unstable weather due to these differences often arises along the boundary. For instance, cold fronts can bring bands of thunderstorms and cumulonimbus precipitation or be preceded by squall lines, while warm fronts are usually preceded by stratiform precipitation and fog. In summer, subtler humidity gradients known as dry lines can trigger severe weather. Some fronts produce no precipitation and little cloudiness, although there is invariably a wind shift.
In meteorology, air currents are concentrated areas of winds. They are mainly due to differences in atmospheric pressure or temperature. They are divided into horizontal and vertical currents; both are present at mesoscale while horizontal ones dominate at synoptic scale. Air currents are not only found in the troposphere, but extend to the stratosphere and mesosphere.
Frontogenesis is a meteorological process of tightening of horizontal temperature gradients to produce fronts. In the end, two types of fronts form: cold fronts and warm fronts. A cold front is a narrow line where temperature decreases rapidly. A warm front is a narrow line of warmer temperatures and essentially where much of the precipitation occurs. Frontogenesis occurs as a result of a developing baroclinic wave. According to Hoskins & Bretherton, there are eight mechanisms that influence temperature gradients: horizontal deformation, horizontal shearing, vertical deformation, differential vertical motion, latent heat release, surface friction, turbulence and mixing, and radiation. Semigeostrophic frontogenesis theory focuses on the role of horizontal deformation and shear.
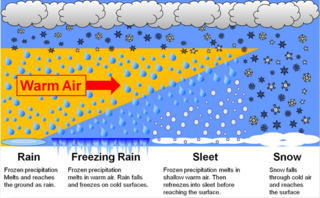
In meteorology, the different types of precipitation often include the character, formation, or phase of the precipitation which is falling to ground level. There are three distinct ways that precipitation can occur. Convective precipitation is generally more intense, and of shorter duration, than stratiform precipitation. Orographic precipitation occurs when moist air is forced upwards over rising terrain and condenses on the slope, such as a mountain.
Gandikota V. Rao was an Indian-American atmospheric scientist who chaired the Department of Earth and Atmospheric Sciences at Saint Louis University (SLU). He was a world-renowned expert on tropical meteorology, monsoon, tropical cyclones, and tropical cyclone tornadoes. He was also known for work on air pollution, atmospheric convection, atmospheric boundary layers, and numerical weather prediction.

A sting jet is a narrow, transient and mesoscale airstream that descends from the mid-troposphere to the surface in some extratropical cyclones. When present, sting jets produce some of the strongest surface-level winds in extratropical cyclones and can generate damaging wind gusts in excess of 50 m/s. Sting jets are short-lived, lasting on the order of hours, and the area subjected to their strong winds is typically no wider than 100 km (62 mi), making their effects highly localised. Studies have identified sting jets in mid-latitude cyclones primarily in the northern Atlantic and western Europe, though they may occur elsewhere. The storms that produce sting jets have tended to follow the Shapiro–Keyser model of extratropical cyclone development. Among these storms, sting jets tend to form following storm's highest rate of intensification.

A cold front is the leading edge of a cooler mass of air at ground level that replaces a warmer mass of air and lies within a pronounced surface trough of low pressure. It often forms behind an extratropical cyclone, at the leading edge of its cold air advection pattern—known as the cyclone's dry "conveyor belt" flow. Temperature differences across the boundary can exceed 30 °C (54 °F) from one side to the other. When enough moisture is present, rain can occur along the boundary. If there is significant instability along the boundary, a narrow line of thunderstorms can form along the frontal zone. If instability is weak, a broad shield of rain can move in behind the front, and evaporative cooling of the rain can increase the temperature difference across the front. Cold fronts are stronger in the fall and spring transition seasons and are weakest during the summer.
This glossary of meteorology is a list of terms and concepts relevant to meteorology and atmospheric science, their sub-disciplines, and related fields.
References
- ↑ Thralls, Zoe A. (1958). The Teaching of Geography. Appleton-Century-Crofts. p. 57. Retrieved 2023-05-13.
- ↑ "Frontolysis - (Meteorology) - Vocab, Definition, Explanations | Fiveable". library.fiveable.me. Retrieved 2024-10-31.
| | This meteorology–related article is a stub. You can help Wikipedia by expanding it. |