
The Gall–Peters projection is a rectangular, equal-area map projection. Like all equal-area projections, it distorts most shapes. It is a cylindrical equal-area projection with latitudes 45° north and south as the regions on the map that have no distortion. The projection is named after James Gall and Arno Peters.
In cartography, a map projection is any of a broad set of transformations employed to represent the curved two-dimensional surface of a globe on a plane. In a map projection, coordinates, often expressed as latitude and longitude, of locations from the surface of the globe are transformed to coordinates on a plane. Projection is a necessary step in creating a two-dimensional map and is one of the essential elements of cartography.
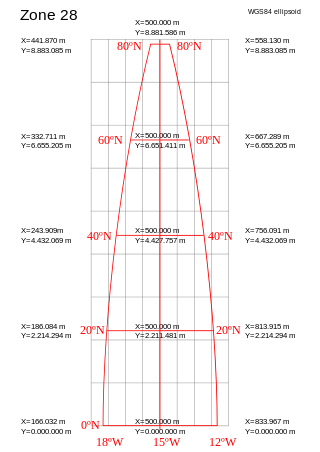
A projected coordinate system – also called a projected coordinate reference system, planar coordinate system, or grid reference system – is a type of spatial reference system that represents locations on Earth using Cartesian coordinates (x, y) on a planar surface created by a particular map projection. Each projected coordinate system, such as "Universal Transverse Mercator WGS 84 Zone 26N," is defined by a choice of map projection (with specific parameters), a choice of geodetic datum to bind the coordinate system to real locations on the earth, an origin point, and a choice of unit of measure. Hundreds of projected coordinate systems have been specified for various purposes in various regions.

The Robinson projection is a map projection of a world map that shows the entire world at once. It was specifically created in an attempt to find a good compromise to the problem of readily showing the whole globe as a flat image.

The Craig retroazimuthal map projection was created by James Ireland Craig in 1909. It is a modified cylindrical projection. As a retroazimuthal projection, it preserves directions from everywhere to one location of interest that is configured during construction of the projection. The projection is sometimes known as the Mecca projection because Craig, who had worked in Egypt as a cartographer, created it to help Muslims find their qibla. In such maps, Mecca is the configurable location of interest.

The Werner projection is a pseudoconic equal-area map projection sometimes called the Stab-Werner or Stabius-Werner projection. Like other heart-shaped projections, it is also categorized as cordiform. Stab-Werner refers to two originators: Johannes Werner (1466–1528), a parish priest in Nuremberg, refined and promoted this projection that had been developed earlier by Johannes Stabius (Stab) of Vienna around 1500.

The Goode homolosine projection is a pseudocylindrical, equal-area, composite map projection used for world maps. Normally it is presented with multiple interruptions, most commonly of the major oceans. Its equal-area property makes it useful for presenting spatial distribution of phenomena.
The Albers equal-area conic projection, or Albers projection, is a conic, equal area map projection that uses two standard parallels. Although scale and shape are not preserved, distortion is minimal between the standard parallels.

Polyconic can refer either to a class of map projections or to a specific projection known less ambiguously as the American polyconic projection. Polyconic as a class refers to those projections whose parallels are all non-concentric circular arcs, except for a straight equator, and the centers of these circles lie along a central axis. This description applies to projections in equatorial aspect.
Alden Partridge Colvocoresses helped to develop the Space-oblique Mercator projection with John P. Snyder and John Junkins, and developed the first satellite map of the United States in 1974.
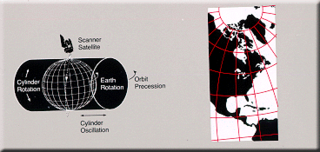
Space-oblique Mercator projection is a map projection devised in the 1970s for preparing maps from Earth-survey satellite data. It is a generalization of the oblique Mercator projection that incorporates the time evolution of a given satellite ground track to optimize its representation on the map. The oblique Mercator projection, on the other hand, optimizes for a given geodesic.

John Parr Snyder was an American cartographer most known for his work on map projections for the United States Geological Survey (USGS). Educated at Purdue and MIT as a chemical engineer, he had a lifetime interest in map projections as a hobby, but found the calculations tedious without the benefit of expensive calculators or computers. At a cartography conference in 1976, he learned of the need for a map projection that would suit the special needs of Landsat satellite imagery. He had recently been able to purchase a pocket calculator (TI-59) of his own and set to work creating what became known as the space-oblique mercator projection, which he provided to the USGS at no charge. Library of Congress historian John Hessler stated it is "perhaps the most complex map projection".

The Peirce quincuncial projection is the conformal map projection from the sphere to an unfolded square dihedron, developed by Charles Sanders Peirce in 1879. Each octant projects onto an isosceles right triangle, and these are arranged into a square. The name quincuncial refers to this arrangement: the north pole at the center and quarters of the south pole in the corners form a quincunx pattern like the pips on the five face of a traditional die. The projection has the distinctive property that it forms a seamless square tiling of the plane, conformal except at four singular points along the equator.

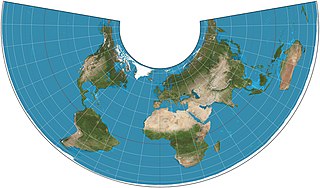
The equidistant conic projection is a conic map projection commonly used for maps of small countries as well as for larger regions such as the continental United States that are elongated east-to-west.

The octant projection or octants projection, is a type of map projection proposed the first time, in 1508, by Leonardo da Vinci in his Codex Atlanticus. Leonardo's authorship would be demonstrated by Christopher Tyler, who stated "For those projections dated later than 1508, his drawings should be effectively considered the original precursors."

The rectangular polyconic projection is a map projection was first mentioned in 1853 by the United States Coast Survey, where it was developed and used for portions of the U.S. exceeding about one square degree. It belongs to the polyconic projection class, which consists of map projections whose parallels are non-concentric circular arcs except for the equator, which is straight. Sometimes the rectangular polyconic is called the War Office projection due to its use by the British War Office for topographic maps. It is not used much these days, with practically all military grid systems having moved onto conformal projection systems, typically modeled on the transverse Mercator projection.

In map projections, an interruption is any place where the globe has been split. All map projections are interrupted at at least one point. Typical world maps are interrupted along an entire meridian. In that typical case, the interruption forms an east/west boundary, even though the globe has no boundaries.

The stereographic projection, also known as the planisphere projection or the azimuthal conformal projection, is a conformal map projection whose use dates back to antiquity. Like the orthographic projection and gnomonic projection, the stereographic projection is an azimuthal projection, and when on a sphere, also a perspective projection.

