
In genetics, dominance is the phenomenon of one variant (allele) of a gene on a chromosome masking or overriding the effect of a different variant of the same gene on the other copy of the chromosome. The first variant is termed dominant and the second is called recessive. This state of having two different variants of the same gene on each chromosome is originally caused by a mutation in one of the genes, either new or inherited. The terms autosomal dominant or autosomal recessive are used to describe gene variants on non-sex chromosomes (autosomes) and their associated traits, while those on sex chromosomes (allosomes) are termed X-linked dominant, X-linked recessive or Y-linked; these have an inheritance and presentation pattern that depends on the sex of both the parent and the child. Since there is only one copy of the Y chromosome, Y-linked traits cannot be dominant or recessive. Additionally, there are other forms of dominance, such as incomplete dominance, in which a gene variant has a partial effect compared to when it is present on both chromosomes, and co-dominance, in which different variants on each chromosome both show their associated traits.
Heritability is a statistic used in the fields of breeding and genetics that estimates the degree of variation in a phenotypic trait in a population that is due to genetic variation between individuals in that population. The concept of heritability can be expressed in the form of the following question: "What is the proportion of the variation in a given trait within a population that is not explained by the environment or random chance?"

Quantitative genetics is the study of quantitative traits, which are phenotypes that vary continuously—such as height or mass—as opposed to phenotypes and gene-products that are discretely identifiable—such as eye-colour, or the presence of a particular biochemical.

Human variability, or human variation, is the range of possible values for any characteristic, physical or mental, of human beings.
A quantitative trait locus (QTL) is a locus that correlates with variation of a quantitative trait in the phenotype of a population of organisms. QTLs are mapped by identifying which molecular markers correlate with an observed trait. This is often an early step in identifying the actual genes that cause the trait variation.
Genetic architecture is the underlying genetic basis of a phenotypic trait and its variational properties. Phenotypic variation for quantitative traits is, at the most basic level, the result of the segregation of alleles at quantitative trait loci (QTL). Environmental factors and other external influences can also play a role in phenotypic variation. Genetic architecture is a broad term that can be described for any given individual based on information regarding gene and allele number, the distribution of allelic and mutational effects, and patterns of pleiotropy, dominance, and epistasis.
A polygene is a member of a group of non-epistatic genes that interact additively to influence a phenotypic trait, thus contributing to multiple-gene inheritance, a type of non-Mendelian inheritance, as opposed to single-gene inheritance, which is the core notion of Mendelian inheritance. The term "monozygous" is usually used to refer to a hypothetical gene as it is often difficult to distinguish the effect of an individual gene from the effects of other genes and the environment on a particular phenotype. Advances in statistical methodology and high throughput sequencing are, however, allowing researchers to locate candidate genes for the trait. In the case that such a gene is identified, it is referred to as a quantitative trait locus (QTL). These genes are generally pleiotropic as well. The genes that contribute to type 2 diabetes are thought to be mostly polygenes. In July 2016, scientists reported identifying a set of 355 genes from the last universal common ancestor (LUCA) of all organisms living on Earth.
In genetics, transgressive segregation is the formation of extreme phenotypes, or transgressive phenotypes, observed in segregated hybrid populations compared to phenotypes observed in the parental lines. The appearance of these transgressive (extreme) phenotypes can be either positive or negative in terms of fitness. If both parents' favorable alleles come together, it will result in a hybrid having a higher fitness than the two parents. The hybrid species will show more genetic variation and variation in gene expression than their parents. As a result, the hybrid species will have some traits that are transgressive (extreme) in nature. Transgressive segregation can allow a hybrid species to populate different environments/niches in which the parent species do not reside, or compete in the existing environment with the parental species.
In multivariate quantitative genetics, a genetic correlation is the proportion of variance that two traits share due to genetic causes, the correlation between the genetic influences on a trait and the genetic influences on a different trait estimating the degree of pleiotropy or causal overlap. A genetic correlation of 0 implies that the genetic effects on one trait are independent of the other, while a correlation of 1 implies that all of the genetic influences on the two traits are identical. The bivariate genetic correlation can be generalized to inferring genetic latent variable factors across > 2 traits using factor analysis. Genetic correlation models were introduced into behavioral genetics in the 1970s–1980s.

Genetic effects are broadly divided into two categories: additive and non-additive. Additive genetic effects occur where expression of more than one gene contributes to phenotype, and the phenotypic expression of these gene(s) can be said to be the sum of these contributions.
Behavioural genetics, also referred to as behaviour genetics, is a field of scientific research that uses genetic methods to investigate the nature and origins of individual differences in behaviour. While the name "behavioural genetics" connotes a focus on genetic influences, the field broadly investigates the extent to which genetic and environmental factors influence individual differences, and the development of research designs that can remove the confounding of genes and environment. Behavioural genetics was founded as a scientific discipline by Francis Galton in the late 19th century, only to be discredited through association with eugenics movements before and during World War II. In the latter half of the 20th century, the field saw renewed prominence with research on inheritance of behaviour and mental illness in humans, as well as research on genetically informative model organisms through selective breeding and crosses. In the late 20th and early 21st centuries, technological advances in molecular genetics made it possible to measure and modify the genome directly. This led to major advances in model organism research and in human studies, leading to new scientific discoveries.
In statistical genetics, inclusive composite interval mapping (ICIM) has been proposed as an approach to QTL mapping for populations derived from bi-parental crosses. QTL mapping is based on genetic linkage map and phenotypic data to attempt to locate individual genetic factors on chromosomes and to estimate their genetic effects.
Quantitative trait loci mapping or QTL mapping is the process of identifying genomic regions that potentially contain genes responsible for important economic, health or environmental characters. Mapping QTLs is an important activity that plant breeders and geneticists routinely use to associate potential causal genes with phenotypes of interest. Family-based QTL mapping is a variant of QTL mapping where multiple-families are used.
Genome-wide complex trait analysis (GCTA) Genome-based restricted maximum likelihood (GREML) is a statistical method for heritability estimation in genetics, which quantifies the total additive contribution of a set of genetic variants to a trait. GCTA is typically applied to common single nucleotide polymorphisms (SNPs) on a genotyping array and thus termed "chip" or "SNP" heritability.
A human disease modifier gene is a modifier gene that alters expression of a human gene at another locus that in turn causes a genetic disease. Whereas medical genetics has tended to distinguish between monogenic traits, governed by simple, Mendelian inheritance, and quantitative traits, with cumulative, multifactorial causes, increasing evidence suggests that human diseases exist on a continuous spectrum between the two.

Epistasis is a phenomenon in genetics in which the effect of a gene mutation is dependent on the presence or absence of mutations in one or more other genes, respectively termed modifier genes. In other words, the effect of the mutation is dependent on the genetic background in which it appears. Epistatic mutations therefore have different effects on their own than when they occur together. Originally, the term epistasis specifically meant that the effect of a gene variant is masked by that of different gene.
This glossary of genetics and evolutionary biology is a list of definitions of terms and concepts used in the study of genetics and evolutionary biology, as well as sub-disciplines and related fields, with an emphasis on classical genetics, quantitative genetics, population biology, phylogenetics, speciation, and systematics. Overlapping and related terms can be found in Glossary of cellular and molecular biology, Glossary of ecology, and Glossary of biology.

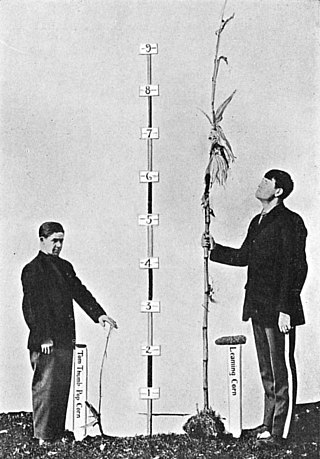
Complex traits are phenotypes that are controlled by two or more genes and do not follow Mendel’s Law of Dominance. They may have a range of expression which is typically continuous. Both environmental and genetic factors often impact the variation in expression. Human height is a continuous trait meaning that there is a wide range of heights. There are an estimated 50 genes that affect the height of a human. Environmental factors, like nutrition, also play a role in a human’s height. Other examples of complex traits include: crop yield, plant color, and many diseases including diabetes and Parkinson's disease. One major goal of genetic research today is to better understand the molecular mechanisms through which genetic variants act to influence complex traits. Complex Traits are also known as polygenic traits and multigenic traits.
The infinitesimal model, also known as the polygenic model, is a widely used statistical model in quantitative genetics and in genome-wide association studies. Originally developed in 1918 by Ronald Fisher, it is based on the idea that variation in a quantitative trait is influenced by an infinitely large number of genes, each of which makes an infinitely small (infinitesimal) contribution to the phenotype, as well as by environmental factors. In "The Correlation between Relatives on the Supposition of Mendelian Inheritance", the original 1918 paper introducing the model, Fisher showed that if a trait is polygenic, "then the random sampling of alleles at each gene produces a continuous, normally distributed phenotype in the population". However, the model does not necessarily imply that the trait must be normally distributed, only that its genetic component will be so around the average of that of the individual's parents. The model served to reconcile Mendelian genetics with the continuous distribution of quantitative traits documented by Francis Galton.

A selection limit is a term from animal breeding and quantitative genetics that refers to a cessation of progress even when continued directional selection is being applied to a trait, such as body size. In other words, a breeder or scientist is using selective breeding and choosing individuals as breeders within a population based on some phenotypic trait or traits. If this is done, then the average value of the population typically evolves across generations in the direction being favored by selection, but then at some point the population stops evolving. The trait under selection is then said to have reached a limit or plateau at that value.
