An allele is one of two, or more, forms of a given gene variant. For example, the ABO blood grouping is controlled by the ABO gene, which has six common alleles. Nearly every living human's phenotype for the ABO gene is some combination of just these six alleles. An allele is one of two, or more, versions of the same gene at the same place on a chromosome. It can also refer to different sequence variations for several-hundred base-pair or more region of the genome that codes for a protein. Alleles can come in different extremes of size. At the lowest possible size an allele can be a single nucleotide polymorphism (SNP). At the higher end, it can be up to several thousand base-pairs long. Most alleles result in little or no observable change in the function of the protein the gene codes for.

In genetics, dominance is the phenomenon of one variant (allele) of a gene on a chromosome masking or overriding the effect of a different variant of the same gene on the other copy of the chromosome. The first variant is termed dominant and the second recessive. This state of having two different variants of the same gene on each chromosome is originally caused by a mutation in one of the genes, either new or inherited. The terms autosomal dominant or autosomal recessive are used to describe gene variants on non-sex chromosomes (autosomes) and their associated traits, while those on sex chromosomes (allosomes) are termed X-linked dominant, X-linked recessive or Y-linked; these have an inheritance and presentation pattern that depends on the sex of both the parent and the child. Since there is only one copy of the Y chromosome, Y-linked traits cannot be dominant nor recessive. Additionally, there are other forms of dominance such as incomplete dominance, in which a gene variant has a partial effect compared to when it is present on both chromosomes, and co-dominance, in which different variants on each chromosome both show their associated traits.

Fitness is the quantitative representation of natural and sexual selection within evolutionary biology. It can be defined either with respect to a genotype or to a phenotype in a given environment. In either case, it describes individual reproductive success and is equal to the average contribution to the gene pool of the next generation that is made by individuals of the specified genotype or phenotype. The fitness of a genotype is manifested through its phenotype, which is also affected by the developmental environment. The fitness of a given phenotype can also be different in different selective environments.
Population genetics is a subfield of genetics that deals with genetic differences within and between populations, and is a part of evolutionary biology. Studies in this branch of biology examine such phenomena as adaptation, speciation, and population structure.
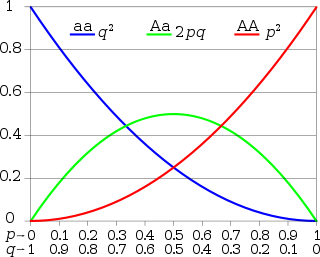
In population genetics, the Hardy–Weinberg principle, also known as the Hardy–Weinberg equilibrium, model, theorem, or law, states that allele and genotype frequencies in a population will remain constant from generation to generation in the absence of other evolutionary influences. These influences include genetic drift, mate choice, assortative mating, natural selection, sexual selection, mutation, gene flow, meiotic drive, genetic hitchhiking, population bottleneck, founder effect and inbreeding.
Allele frequency, or gene frequency, is the relative frequency of an allele at a particular locus in a population, expressed as a fraction or percentage. Specifically, it is the fraction of all chromosomes in the population that carry that allele. Microevolution is the change in allele frequencies that occurs over time within a population.

Quantitative genetics deals with phenotypes that vary continuously —as opposed to discretely identifiable phenotypes and gene-products.

The Punnett square is a square diagram that is used to predict the genotypes of a particular cross or breeding experiment. It is named after Reginald C. Punnett, who devised the approach in 1905. The diagram is used by biologists to determine the probability of an offspring having a particular genotype. The Punnett square is a tabular summary of possible combinations of maternal alleles with paternal alleles. These tables can be used to examine the genotypical outcome probabilities of the offspring of a single trait (allele), or when crossing multiple traits from the parents. The Punnett square is a visual representation of Mendelian inheritance. It is important to understand the terms "heterozygous", "homozygous", "double heterozygote", "dominant allele" and "recessive allele" when using the Punnett square method. For multiple traits, using the "forked-line method" is typically much easier than the Punnett square. Phenotypes may be predicted with at least better-than-chance accuracy using a Punnett square, but the phenotype that may appear in the presence of a given genotype can in some instances be influenced by many other factors, as when polygenic inheritance and/or epigenetics are at work.
In population genetics, linkage disequilibrium (LD) is the non-random association of alleles at different loci in a given population. Loci are said to be in linkage disequilibrium when the frequency of association of their different alleles is higher or lower than what would be expected if the loci were independent and associated randomly.
In population genetics, F-statistics describe the statistically expected level of heterozygosity in a population; more specifically the expected degree of (usually) a reduction in heterozygosity when compared to Hardy–Weinberg expectation.
Balancing selection refers to a number of selective processes by which multiple alleles are actively maintained in the gene pool of a population at frequencies larger than expected from genetic drift alone. This can happen by various mechanisms, in particular, when the heterozygotes for the alleles under consideration have a higher fitness than the homozygote. In this way genetic polymorphism is conserved.
A heterozygote advantage describes the case in which the heterozygous genotype has a higher relative fitness than either the homozygous dominant or homozygous recessive genotype. The specific case of heterozygote advantage due to a single locus is known as overdominance. Overdominance is a condition in genetics where the phenotype of the heterozygote lies outside of the phenotypical range of both homozygote parents, and heterozygous individuals have a higher fitness than homozygous individuals.

In population genetics, the Wahlund effect is a reduction of heterozygosity in a population caused by subpopulation structure. Namely, if two or more subpopulations are in a Hardy–Weinberg equilibrium but have different allele frequencies, the overall heterozygosity is reduced compared to if the whole population was in equilibrium. The underlying causes of this population subdivision could be geographic barriers to gene flow followed by genetic drift in the subpopulations.
Genetic load is the difference between the fitness of an average genotype in a population and the fitness of some reference genotype, which may be either the best present in a population, or may be the theoretically optimal genotype. The average individual taken from a population with a low genetic load will generally, when grown in the same conditions, have more surviving offspring than the average individual from a population with a high genetic load. Genetic load can also be seen as reduced fitness at the population level compared to what the population would have if all individuals had the reference high-fitness genotype. High genetic load may put a population in danger of extinction.
Mutation–selection balance is an equilibrium in the number of deleterious alleles in a population that occurs when the rate at which deleterious alleles are created by mutation equals the rate at which deleterious alleles are eliminated by selection. The majority of genetic mutations are neutral or deleterious; beneficial mutations are relatively rare. The resulting influx of deleterious mutations into a population over time is counteracted by negative selection, which acts to purge deleterious mutations. Setting aside other factors, the equilibrium number of deleterious alleles is then determined by a balance between the deleterious mutation rate and the rate at which selection purges those mutations.
In genetics, underdominance is the opposite of overdominance. It is the selection against the heterozygote, causing disruptive selection and divergent genotypes. Underdominance exists in situations where the heterozygotic genotype is inferior in fitness to either the dominant or recessive homozygotic genotype. Compared to examples of overdominance in actual populations, underdominance is considered more unstable and may lead to the fixation of either allele.
The general selection model (GSM) is a model of population genetics that describes how a population's allele frequencies will change when acted upon by natural selection.

Zygosity is the degree to which both copies of a chromosome or gene have the same genetic sequence. In other words, it is the degree of similarity of the alleles in an organism.
Host–parasite coevolution is a special case of coevolution, the reciprocal adaptive genetic change of a host and a parasite through reciprocal selective pressures.
Additive disequilibrium (D) is a statistic that estimates the difference between observed genotypic frequencies and the genotypic frequencies that would be expected under Hardy–Weinberg equilibrium. At a biallelic locus with alleles 1 and 2, the additive disequilibrium exists according to the equations


