Ternary plot

Last updated
A ternary flammability diagram, showing which mixtures of methane, oxygen gas, and inert nitrogen gas will burn Flammability diagram methane.svg
A ternary flammability diagram, showing which mixtures of methane, oxygen gas, and inert nitrogen gas will burn

A ternary plot, ternary graph, triangle plot, simplex plot, or Gibbs triangle is a barycentric plot on three variables which sum to a constant. [1] It graphically depicts the ratios of the three variables as positions in an equilateral triangle. It is used in physical chemistry, petrology, mineralogy, metallurgy, and other physical sciences to show the compositions of systems composed of three species. In population genetics, a triangle plot of genotype frequencies is called a de Finetti diagram. In game theory, it is often called a simplex plot. [2] Ternary plots are tools for analyzing compositional data in the three-dimensional case.

Contents

In a ternary plot, the values of the three variables a, b, and c must sum to some constant, K. Usually, this constant is represented as 1.0 or 100%. Because a + b + c = K for all substances being graphed, any one variable is not independent of the others, so only two variables must be known to find a sample's point on the graph: for instance, c must be equal to Kab. Because the three numerical values cannot vary independently—there are only two degrees of freedom—it is possible to graph the combinations of all three variables in only two dimensions.

The advantage of using a ternary plot for depicting chemical compositions is that three variables can be conveniently plotted in a two-dimensional graph. Ternary plots can also be used to create phase diagrams by outlining the composition regions on the plot where different phases exist.

The values of a point on a ternary plot correspond (up to a constant) to its trilinear coordinates or barycentric coordinates.

Reading values on a ternary plot

There are three equivalent methods that can be used to determine the values of a point on the plot:

  1. Parallel line or grid method. The first method is to use a diagram grid consisting of lines parallel to the triangle edges. A parallel to a side of the triangle is the locus of points constant in the component situated in the vertex opposed to the side. Each component is 100% in a corner of the triangle and 0% at the edge opposite it, decreasing linearly with increasing distance (perpendicular to the opposite edge) from this corner. By drawing parallel lines at regular intervals between the zero line and the corner, fine divisions can be established for easy estimation.
  2. Perpendicular line or altitude method. For diagrams that do not possess grid lines, the easiest way to determine the values is to determine the shortest (i.e. perpendicular) distances from the point of interest to each of the three sides. By Viviani's theorem, the distances (or the ratios of the distances to the triangle height) give the value of each component.
  3. Corner line or intersection method. The third method does not require the drawing of perpendicular or parallel lines. Straight lines are drawn from each corner, through the point of interest, to the opposite side of the triangle. The lengths of these lines, as well as the lengths of the segments between the point and the corresponding sides, are measured individually. The ratio of the measured lines then gives the component value as a fraction of 100%.

A displacement along a parallel line (grid line) preserves the sum of two values, while motion along a perpendicular line increases (or decreases) the two values an equal amount, each half of the decrease (increase) of the third value. Motion along a line through a corner preserves the ratio of the other two values.

Derivation from Cartesian coordinates

Derivation of a ternary plot from Cartesian coordinates Ternary plot visualisation.svg
Derivation of a ternary plot from Cartesian coordinates

Figure (1) shows an oblique projection of point P(a,b,c) in a 3-dimensional Cartesian space with axes a, b and c, respectively.

If a + b + c = K (a positive constant), P is restricted to a plane containing A(K,0,0), B(0,K,0) and C(0,0,K). If a, b and c each cannot be negative, P is restricted to the triangle bounded by A, B and C, as in (2).

In (3), the axes are rotated to give an isometric view. The triangle, viewed face-on, appears equilateral.

In (4), the distances of P from lines BC, AC and AB are denoted by a, b and c, respectively.

For any line l = s + tn̂ in vector form (n̂ is a unit vector) and a point p, the perpendicular distance from p to l is

In this case, point P is at

Line BC has

Using the perpendicular distance formula,

Substituting K = a + b + c,

Similar calculation on lines AC and AB gives

This shows that the distance of the point from the respective lines is linearly proportional to the original values a, b and c. [3]

Plotting a ternary plot

Analogue on a Cartesian grid by adding lines of slope -1. The scale of the c axis is
1
2
{\textstyle {\frac {1}{\sqrt {2}}}}
that of the a and b axes. The cross denotes the point a = b = c. Rectangular ternary plot.svg
Analogue on a Cartesian grid by adding lines of slope −1. The scale of the c axis is that of the a and b axes. The cross denotes the point a = b = c.

Cartesian coordinates are useful for plotting points in the triangle. Consider an equilateral ternary plot where a = 100% is placed at (x,y) = (0,0) and b = 100% at (1,0). Then c = 100% is and the triple (a,b,c) is

Example

A colorized soil textural triangle from the United States Department of Agriculture SoilTexture USDA.svg
A colorized soil textural triangle from the United States Department of Agriculture

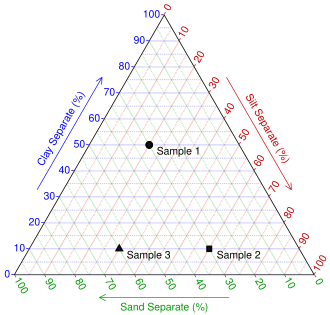
This example shows how this works for a hypothetical set of three soil samples:

SampleClaySiltSandNotes
Sample 150%20%30%Because clay and silt together make up 70% of this sample, the proportion of sand must be 30% for the components to sum to 100%.
Sample 210%60%30%The proportion of sand is 30% as in Sample 1, but as the proportion of silt rises by 40%, the proportion of clay decreases correspondingly.
Sample 310%30%60%This sample has the same proportion of clay as Sample 2, but the proportions of silt and sand are swapped; the plot is reflected about its vertical axis.

Plotting the points

List of notable ternary diagrams

See also

Related Research Articles

<span class="mw-page-title-main">Cartesian coordinate system</span> Most common coordinate system (geometry)

In geometry, a Cartesian coordinate system in a plane is a coordinate system that specifies each point uniquely by a pair of real numbers called coordinates, which are the signed distances to the point from two fixed perpendicular oriented lines, called coordinate lines, coordinate axes or just axes of the system. The point where they meet is called the origin and has (0, 0) as coordinates.

<span class="mw-page-title-main">Ellipse</span> Plane curve: conic section

In mathematics, an ellipse is a plane curve surrounding two focal points, such that for all points on the curve, the sum of the two distances to the focal points is a constant. It generalizes a circle, which is the special type of ellipse in which the two focal points are the same. The elongation of an ellipse is measured by its eccentricity , a number ranging from to .

<span class="mw-page-title-main">Tetrahedron</span> Polyhedron with 4 faces

In geometry, a tetrahedron, also known as a triangular pyramid, is a polyhedron composed of four triangular faces, six straight edges, and four vertex corners. The tetrahedron is the simplest of all the ordinary convex polyhedra.

<span class="mw-page-title-main">Law of sines</span> Property of all triangles on a Euclidean plane

In trigonometry, the law of sines, sine law, sine formula, or sine rule is an equation relating the lengths of the sides of any triangle to the sines of its angles. According to the law,

In mathematics, the matrix representation of conic sections permits the tools of linear algebra to be used in the study of conic sections. It provides easy ways to calculate a conic section's axis, vertices, tangents and the pole and polar relationship between points and lines of the plane determined by the conic. The technique does not require putting the equation of a conic section into a standard form, thus making it easier to investigate those conic sections whose axes are not parallel to the coordinate system.

<span class="mw-page-title-main">Four-vector</span> 4-dimensional vector in relativity

In special relativity, a four-vector is an object with four components, which transform in a specific way under Lorentz transformations. Specifically, a four-vector is an element of a four-dimensional vector space considered as a representation space of the standard representation of the Lorentz group, the representation. It differs from a Euclidean vector in how its magnitude is determined. The transformations that preserve this magnitude are the Lorentz transformations, which include spatial rotations and boosts.

<span class="mw-page-title-main">Euler equations (fluid dynamics)</span> Set of quasilinear hyperbolic equations governing adiabatic and inviscid flow

In fluid dynamics, the Euler equations are a set of quasilinear partial differential equations governing adiabatic and inviscid flow. They are named after Leonhard Euler. In particular, they correspond to the Navier–Stokes equations with zero viscosity and zero thermal conductivity.

<span class="mw-page-title-main">Barycentric coordinate system</span> Coordinate system that is defined by points instead of vectors

In geometry, a barycentric coordinate system is a coordinate system in which the location of a point is specified by reference to a simplex. The barycentric coordinates of a point can be interpreted as masses placed at the vertices of the simplex, such that the point is the center of mass of these masses. These masses can be zero or negative; they are all positive if and only if the point is inside the simplex.

<span class="mw-page-title-main">Euler's rotation theorem</span> Movement with a fixed point is rotation

In geometry, Euler's rotation theorem states that, in three-dimensional space, any displacement of a rigid body such that a point on the rigid body remains fixed, is equivalent to a single rotation about some axis that runs through the fixed point. It also means that the composition of two rotations is also a rotation. Therefore the set of rotations has a group structure, known as a rotation group.

<span class="mw-page-title-main">Rössler attractor</span> Attractor for chaotic Rössler system

The Rössler attractor is the attractor for the Rössler system, a system of three non-linear ordinary differential equations originally studied by Otto Rössler in the 1970s. These differential equations define a continuous-time dynamical system that exhibits chaotic dynamics associated with the fractal properties of the attractor. Rössler interpreted it as a formalization of a taffy-pulling machine.

In geometry, the circumscribed circle or circumcircle of a triangle is a circle that passes through all three vertices. The center of this circle is called the circumcenter of the triangle, and its radius is called the circumradius. The circumcenter is the point of intersection between the three perpendicular bisectors of the triangle's sides, and is a triangle center.

<span class="mw-page-title-main">Savitzky–Golay filter</span> Algorithm to smooth data points

A Savitzky–Golay filter is a digital filter that can be applied to a set of digital data points for the purpose of smoothing the data, that is, to increase the precision of the data without distorting the signal tendency. This is achieved, in a process known as convolution, by fitting successive sub-sets of adjacent data points with a low-degree polynomial by the method of linear least squares. When the data points are equally spaced, an analytical solution to the least-squares equations can be found, in the form of a single set of "convolution coefficients" that can be applied to all data sub-sets, to give estimates of the smoothed signal, at the central point of each sub-set. The method, based on established mathematical procedures, was popularized by Abraham Savitzky and Marcel J. E. Golay, who published tables of convolution coefficients for various polynomials and sub-set sizes in 1964. Some errors in the tables have been corrected. The method has been extended for the treatment of 2- and 3-dimensional data.

<span class="mw-page-title-main">Trilinear coordinates</span> Coordinate system based on distances from the sidelines of a given triangle

In geometry, the trilinear coordinatesx : y : z of a point relative to a given triangle describe the relative directed distances from the three sidelines of the triangle. Trilinear coordinates are an example of homogeneous coordinates. The ratio x : y is the ratio of the perpendicular distances from the point to the sides opposite vertices A and B respectively; the ratio y : z is the ratio of the perpendicular distances from the point to the sidelines opposite vertices B and C respectively; and likewise for z : x and vertices C and A.

<span class="mw-page-title-main">Rapidity</span> Measure of relativistic velocity

In relativity, rapidity is commonly used as a measure for relativistic velocity. Mathematically, rapidity can be defined as the hyperbolic angle that differentiates two frames of reference in relative motion, each frame being associated with distance and time coordinates.

In probability theory and statistics, partial correlation measures the degree of association between two random variables, with the effect of a set of controlling random variables removed. When determining the numerical relationship between two variables of interest, using their correlation coefficient will give misleading results if there is another confounding variable that is numerically related to both variables of interest. This misleading information can be avoided by controlling for the confounding variable, which is done by computing the partial correlation coefficient. This is precisely the motivation for including other right-side variables in a multiple regression; but while multiple regression gives unbiased results for the effect size, it does not give a numerical value of a measure of the strength of the relationship between the two variables of interest.

In mathematics, specifically multilinear algebra, a dyadic or dyadic tensor is a second order tensor, written in a notation that fits in with vector algebra.

Spin is an intrinsic form of angular momentum carried by elementary particles, and thus by composite particles such as hadrons, atomic nuclei, and atoms. Spin should not be understood as in the "rotating internal mass" sense: spin is a quantized wave property.

In Euclidean geometry, the distance from a point to a line is the shortest distance from a given point to any point on an infinite straight line. It is the perpendicular distance of the point to the line, the length of the line segment which joins the point to nearest point on the line. The algebraic expression for calculating it can be derived and expressed in several ways.

<span class="mw-page-title-main">Pythagorean theorem</span> Relation between sides of a right triangle

In mathematics, the Pythagorean theorem or Pythagoras' theorem is a fundamental relation in Euclidean geometry between the three sides of a right triangle. It states that the area of the square whose side is the hypotenuse is equal to the sum of the areas of the squares on the other two sides.

In pure and applied mathematics, particularly quantum mechanics and computer graphics and their applications, a spherical basis is the basis used to express spherical tensors. The spherical basis closely relates to the description of angular momentum in quantum mechanics and spherical harmonic functions.

References

  1. Weisstein, Eric W. "Ternary Diagram". mathworld.wolfram.com. Retrieved 2021-06-05.
  2. Karl Tuyls, "An evolutionary game-theoretic analysis of poker strategies", Entertainment Computing January 2009 doi : 10.1016/j.entcom.2009.09.002, p. 9
  3. Vaughan, Will (September 5, 2010). "Ternary plots". Archived from the original on December 20, 2010. Retrieved September 7, 2010.