
glue (styled with a lower-case "g") is an interactive linked-view data visualization package for exploring relationships within and between related datasets. [1]
glue (styled with a lower-case "g") is an interactive linked-view data visualization package for exploring relationships within and between related datasets. [1]
glue, as working visualization software, was created and realized in 2012, after being described as a work-in-progress in Principles of High-Dimensional Data Visualization in Astronomy. [2]
Using glue, users can create scatter plots, histograms, tables, and images (2D and 3D) of their data. glue is focused on the brushing and linking paradigm, where selections in any graph propagate to all others. glue uses the logical links that exist between different data sets to overlay visualizations of different data, and to propagate selections across data sets. These links are specified by the user, and are arbitrarily flexible. glue is written in Python, and built on top of its standard scientific libraries (i.e., Numpy, Matplotlib, Scipy, Vispy). glue is distributed as part of the Anaconda Python distribution, and is available on MacOS X, Linux, and Windows platforms.
glue offers a high-level of customization, and users can easily integrate their own Python code for data input, export, cleaning, and analysis. Examples of customization include automatically loading and cleaning data before starting glue, writing custom functions to parse files in a preferred file format, writing custom functions to link datasets, or creating custom data viewers. [3] [4]
glue is being used on astronomy data of star forming-clouds, medical data including brain scans, and many other kinds of data. [5] Several plugins exist to extend glue's functionality to a wide range of fields. These include glue-medical to parse medical imaging data (e.g. DICOM files), glue-geospatial for GIS visualization, glue-openspace to interface with the OpenSpace planetarium software, and glue-wwt to support interoperability with the WorldWide Telescope software. [6]
In 2019, glue gained attention for its role in astronomers' discovery of the Radcliffe wave, an enormous gaseous structure that was only able to be seen with the assistance of new 3D mapping techniques. [7] In 2023, glue played an instrumental role in the discovery and rendering in Augmented reality of a Superbubble between Perseus (constellation) and Taurus (constellation). [8]
Originally built on the Qt GUI framework for use on the desktop, an entirely browser-based version of glue (glupyter) is being developed for the Project Jupyter ecosystem, including Jupyter notebooks and JupyterLab. [9]
Hierarchical Data Format (HDF) is a set of file formats designed to store and organize large amounts of data. Originally developed at the U.S. National Center for Supercomputing Applications, it is supported by The HDF Group, a non-profit corporation whose mission is to ensure continued development of HDF5 technologies and the continued accessibility of data stored in HDF.
DokuWiki is an open source wiki application licensed under GPLv2 and written in the PHP programming language. It works on plain text files and thus does not need a database. Its syntax is similar to the one used by MediaWiki. It is often recommended as a more lightweight, easier to customize alternative to MediaWiki. The 'Doku' in DokuWiki is short for Dokumentation which in German means documentation.

Stata is a general-purpose statistical software package developed by StataCorp for data manipulation, visualization, statistics, and automated reporting. It is used by researchers in many fields, including biomedicine, economics, epidemiology, and sociology.
Quartz Composer is a node graph system provided as part of the Xcode development environment in macOS for processing and rendering graphical data. It is capable of making sophisticated animations for keynote or presentations, and creating animated screensavers.
ImageJ is a Java-based image processing program developed at the National Institutes of Health and the Laboratory for Optical and Computational Instrumentation. Its first version, ImageJ 1.x, is developed in the public domain, while ImageJ2 and the related projects SciJava, ImgLib2, and SCIFIO are licensed with a permissive BSD-2 license. ImageJ was designed with an open architecture that provides extensibility via Java plugins and recordable macros. Custom acquisition, analysis and processing plugins can be developed using ImageJ's built-in editor and a Java compiler. User-written plugins make it possible to solve many image processing and analysis problems, from three-dimensional live-cell imaging to radiological image processing, multiple imaging system data comparisons to automated hematology systems. ImageJ's plugin architecture and built-in development environment has made it a popular platform for teaching image processing.

A call graph is a control-flow graph, which represents calling relationships between subroutines in a computer program. Each node represents a procedure and each edge (f, g) indicates that procedure f calls procedure g. Thus, a cycle in the graph indicates recursive procedure calls.
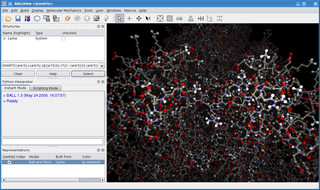
BALL is a C++ class framework and set of algorithms and data structures for molecular modelling and computational structural bioinformatics, a Python interface to this library, and a graphical user interface to BALL, the molecule viewer BALLView.

ParaView is an open-source multiple-platform application for interactive, scientific visualization. It has a client–server architecture to facilitate remote visualization of datasets, and generates level of detail (LOD) models to maintain interactive frame rates for large datasets. It is an application built on top of the Visualization Toolkit (VTK) libraries. ParaView is an application designed for data parallelism on shared-memory or distributed-memory multicomputers and clusters. It can also be run as a single-computer application.

QtiPlot is a cross-platform computer program for interactive scientific graphing and data analysis. It is similar to Origin or SigmaPlot.
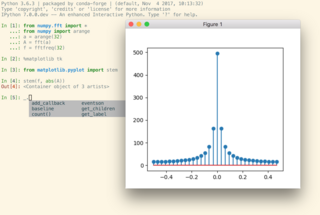
IPython is a command shell for interactive computing in multiple programming languages, originally developed for the Python programming language, that offers introspection, rich media, shell syntax, tab completion, and history. IPython provides the following features:

VisIt is an open-source, interactive parallel visualization, and graphical analysis tool designed for viewing scientific data. It can visualize scalar and vector fields on 2D and 3D structured and unstructured meshes.
Mapnik is an open-source mapping toolkit for desktop and server based map rendering, written in C++. Artem Pavlenko, the original developer of Mapnik, set out with the explicit goal of creating beautiful maps by employing the sub-pixel anti-aliasing of the Anti-Grain Geometry (AGG) library. Mapnik now also has a Cairo rendering backend. For handling common software tasks such as memory management, file system access, regular expressions, and XML parsing, Mapnik utilizes the Boost C++ libraries. An XML file can be used to define a collection of mapping objects that determine the appearance of a map, or objects can be constructed programmatically in C++, Python, and Node.js.
KNIME, the Konstanz Information Miner, is a free and open-source data analytics, reporting and integration platform. KNIME integrates various components for machine learning and data mining through its modular data pipelining "Building Blocks of Analytics" concept. A graphical user interface and use of JDBC allows assembly of nodes blending different data sources, including preprocessing, for modeling, data analysis and visualization without, or with minimal, programming.
Spyder is an open-source cross-platform integrated development environment (IDE) for scientific programming in the Python language. Spyder integrates with a number of prominent packages in the scientific Python stack, including NumPy, SciPy, Matplotlib, pandas, IPython, SymPy and Cython, as well as other open-source software. It is released under the MIT license.
Apache Drill is an open-source software framework that supports data-intensive distributed applications for interactive analysis of large-scale datasets. Built chiefly by contributions from developers from MapR, Drill is inspired by Google's Dremel system. Drill is an Apache top-level project. Tom Shiran is the founder of the Apache Drill Project. It was designated an Apache Software Foundation top-level project in December 2016.
Plotly is a technical computing company headquartered in Montreal, Quebec, that develops online data analytics and visualization tools. Plotly provides online graphing, analytics, and statistics tools for individuals and collaboration, as well as scientific graphing libraries for Python, R, MATLAB, Perl, Julia, Arduino, JavaScript and REST.
Anaconda is a distribution of the Python and R programming languages for scientific computing, that aims to simplify package management and deployment. The distribution includes data-science packages suitable for Windows, Linux, and macOS. It is developed and maintained by Anaconda, Inc., which was founded by Peter Wang and Travis Oliphant in 2012. As an Anaconda, Inc. product, it is also known as Anaconda Distribution or Anaconda Individual Edition, while other products from the company are Anaconda Team Edition and Anaconda Enterprise Edition, neither of which is free.
spaCy is an open-source software library for advanced natural language processing, written in the programming languages Python and Cython. The library is published under the MIT license and its main developers are Matthew Honnibal and Ines Montani, the founders of the software company Explosion.

The Radcliffe wave is a neighbouring coherent gaseous structure in the Milky Way, dotted with a related high concentration of interconnected stellar nurseries. It stretches about 8,800 light years. This structure runs with the trajectory of the Milky Way arms.