Harris affine region detector

Last updated

In the fields of computer vision and image analysis, the Harris affine region detector belongs to the category of feature detection. Feature detection is a preprocessing step of several algorithms that rely on identifying characteristic points or interest points so to make correspondences between images, recognize textures, categorize objects or build panoramas.

Contents

Overview

The Harris affine detector can identify similar regions between images that are related through affine transformations and have different illuminations. These affine-invariant detectors should be capable of identifying similar regions in images taken from different viewpoints that are related by a simple geometric transformation: scaling, rotation and shearing. These detected regions have been called both invariant and covariant. On one hand, the regions are detected invariant of the image transformation but the regions covariantly change with image transformation. [1] Do not dwell too much on these two naming conventions; the important thing to understand is that the design of these interest points will make them compatible across images taken from several viewpoints. Other detectors that are affine-invariant include Hessian affine region detector, Maximally stable extremal regions, Kadir–Brady saliency detector, edge-based regions (EBR) and intensity-extrema-based regions (IBR).

Mikolajczyk and Schmid (2002) first described the Harris affine detector as it is used today in An Affine Invariant Interest Point Detector. [2] Earlier works in this direction include use of affine shape adaptation by Lindeberg and Garding for computing affine invariant image descriptors and in this way reducing the influence of perspective image deformations, [3] the use affine adapted feature points for wide baseline matching by Baumberg [4] and the first use of scale invariant feature points by Lindeberg; [5] [6] [7] for an overview of the theoretical background. The Harris affine detector relies on the combination of corner points detected through Harris corner detection, multi-scale analysis through Gaussian scale space and affine normalization using an iterative affine shape adaptation algorithm. The recursive and iterative algorithm follows an iterative approach to detecting these regions:

  1. Identify initial region points using scale-invariant Harris–Laplace detector.
  2. For each initial point, normalize the region to be affine invariant using affine shape adaptation.
  3. Iteratively estimate the affine region: selection of proper integration scale, differentiation scale and spatially localize interest points..
  4. Update the affine region using these scales and spatial localizations.
  5. Repeat step 3 if the stopping criterion is not met.

Algorithm description

Harris–Laplace detector (initial region points)

The Harris affine detector relies heavily on both the Harris measure and a Gaussian scale space representation. Therefore, a brief examination of both follow. For a more exhaustive derivations see corner detection and Gaussian scale space or their associated papers. [6] [8]

Harris corner measure

The Harris corner detector algorithm relies on a central principle: at a corner, the image intensity will change largely in multiple directions. This can alternatively be formulated by examining the changes of intensity due to shifts in a local window. Around a corner point, the image intensity will change greatly when the window is shifted in an arbitrary direction. Following this intuition and through a clever decomposition, the Harris detector uses the second moment matrix as the basis of its corner decisions. (See corner detection for a more complete derivation). The matrix , has also been called the autocorrelation matrix and has values closely related to the derivatives of image intensity.

where and are the respective derivatives (of pixel intensity) in the and direction at point (,); and are the position parameters of the weighting function w. The off-diagonal entries are the product of and , while the diagonal entries are squares of the respective derivatives. The weighting function can be uniform, but is more typically an isotropic, circular Gaussian,

that acts to average in a local region while weighting those values near the center more heavily.

As it turns out, this matrix describes the shape of the autocorrelation measure as due to shifts in window location. Thus, if we let and be the eigenvalues of , then these values will provide a quantitative description of how the autocorrelation measure changes in space: its principal curvatures. As Harris and Stephens (1988) point out, the matrix centered on corner points will have two large, positive eigenvalues. [8] Rather than extracting these eigenvalues using methods like singular value decomposition, the Harris measure based on the trace and determinant is used:

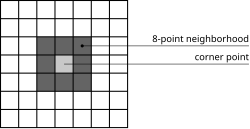
where is a constant. Corner points have large, positive eigenvalues and would thus have a large Harris measure. Thus, corner points are identified as local maxima of the Harris measure that are above a specified threshold.

where are the set of all corner points, is the Harris measure calculated at , is an 8-neighbor set centered on and is a specified threshold.

8-Point neighborhood Eight point neighborhood.svg
8-Point neighborhood

Gaussian scale-space

A Gaussian scale space representation of an image is the set of images that result from convolving a Gaussian kernel of various sizes with the original image. In general, the representation can be formulated as:

where is an isotropic, circular Gaussian kernel as defined above. The convolution with a Gaussian kernel smooths the image using a window the size of the kernel. A larger scale, , corresponds to a smoother resultant image. Mikolajczyk and Schmid (2001) point out that derivatives and other measurements must be normalized across scales. [9] A derivative of order , , must be normalized by a factor in the following manner:

These derivatives, or any arbitrary measure, can be adapted to a scale space representation by calculating this measure using a set of scales recursively where the th scale is . See scale space for a more complete description.

Combining Harris detector across Gaussian scale-space

The Harris-Laplace detector combines the traditional 2D Harris corner detector with the idea of a Gaussian scale space representation in order to create a scale-invariant detector. Harris-corner points are good starting points because they have been shown to have good rotational and illumination invariance in addition to identifying the interesting points of the image. [10] However, the points are not scale invariant and thus the second-moment matrix must be modified to reflect a scale-invariant property. Let us denote, as the scale adapted second-moment matrix used in the Harris-Laplace detector.

[11]

where is the Gaussian kernel of scale and . Similar to the Gaussian-scale space, is the Gaussian-smoothed image. The operator denotes convolution. and are the derivatives in their respective direction applied to the smoothed image and calculated using a Gaussian kernel with scale . In terms of our Gaussian scale-space framework, the parameter determines the current scale at which the Harris corner points are detected.

Building upon this scale-adapted second-moment matrix, the Harris-Laplace detector is a twofold process: applying the Harris corner detector at multiple scales and automatically choosing the characteristic scale.

Multi-scale Harris corner points

The algorithm searches over a fixed number of predefined scales. This set of scales is defined as:

Mikolajczyk and Schmid (2004) use . For each integration scale, , chosen from this set, the appropriate differentiation scale is chosen to be a constant factor of the integration scale: . Mikolajczyk and Schmid (2004) used . [11] Using these scales, the interest points are detected using a Harris measure on the matrix. The cornerness, like the typical Harris measure, is defined as:

Like the traditional Harris detector, corner points are those local (8 point neighborhood) maxima of the cornerness that are above a specified threshold.

Characteristic scale identification

An iterative algorithm based on Lindeberg (1998) both spatially localizes the corner points and selects the characteristic scale. [6] The iterative search has three key steps, that are carried for each point that were initially detected at scale by the multi-scale Harris detector ( indicates the iteration):

  • Choose the scale that maximizes the Laplacian-of-Gaussians (LoG) over a predefined range of neighboring scales. The neighboring scales are typically chosen from a range that is within a two scale-space neighborhood. That is, if the original points were detected using a scaling factor of between successive scales, a two scale-space neighborhood is the range . Thus the Gaussian scales examined are: . The LoG measurement is defined as:
where and are the second derivatives in their respective directions. [12] The factor (as discussed above in Gaussian scale-space) is used to normalize the LoG across scales and make these measures comparable, thus making a maximum relevant. Mikolajczyk and Schmid (2001) demonstrate that the LoG measure attains the highest percentage of correctly detected corner points in comparison to other scale-selection measures. [9] The scale which maximizes this LoG measure in the two scale-space neighborhood is deemed the characteristic scale, , and used in subsequent iterations. If no extrema, or maxima of the LoG is found, this point is discarded from future searches.
  • Using the characteristic scale, the points are spatially localized. That is to say, the point is chosen such that it maximizes the Harris corner measure (cornerness as defined above) within an 8×8 local neighborhood.
  • Stopping criterion: and .

If the stopping criterion is not met, then the algorithm repeats from step 1 using the new points and scale. When the stopping criterion is met, the found points represent those that maximize the LoG across scales (scale selection) and maximize the Harris corner measure in a local neighborhood (spatial selection).

Affine-invariant points

Mathematical theory

The Harris-Laplace detected points are scale invariant and work well for isotropic regions that are viewed from the same viewing angle. In order to be invariant to arbitrary affine transformations (and viewpoints), the mathematical framework must be revisited. The second-moment matrix is defined more generally for anisotropic regions:

where and are covariance matrices defining the differentiation and the integration Gaussian kernel scales. Although this may look significantly different from the second-moment matrix in the Harris-Laplace detector; it is in fact, identical. The earlier matrix was the 2D-isotropic version in which the covariance matrices and were 2x2 identity matrices multiplied by factors and , respectively. In the new formulation, one can think of Gaussian kernels as a multivariate Gaussian distributions as opposed to a uniform Gaussian kernel. A uniform Gaussian kernel can be thought of as an isotropic, circular region. Similarly, a more general Gaussian kernel defines an ellipsoid. In fact, the eigenvectors and eigenvalues of the covariance matrix define the rotation and size of the ellipsoid. Thus we can easily see that this representation allows us to completely define an arbitrary elliptical affine region over which we want to integrate or differentiate.

The goal of the affine invariant detector is to identify regions in images that are related through affine transformations. We thus consider a point and the transformed point , where A is an affine transformation. In the case of images, both and live in space. The second-moment matrices are related in the following manner: [3]

where and are the covariance matrices for the reference frame. If we continue with this formulation and enforce that

where and are scalar factors, one can show that the covariance matrices for the related point are similarly related:

By requiring the covariance matrices to satisfy these conditions, several nice properties arise. One of these properties is that the square root of the second-moment matrix, will transform the original anisotropic region into isotropic regions that are related simply through a pure rotation matrix . These new isotropic regions can be thought of as a normalized reference frame. The following equations formulate the relation between the normalized points and :

The rotation matrix can be recovered using gradient methods likes those in the SIFT descriptor. As discussed with the Harris detector, the eigenvalues and eigenvectors of the second-moment matrix, characterize the curvature and shape of the pixel intensities. That is, the eigenvector associated with the largest eigenvalue indicates the direction of largest change and the eigenvector associated with the smallest eigenvalue defines the direction of least change. In the 2D case, the eigenvectors and eigenvalues define an ellipse. For an isotropic region, the region should be circular in shape and not elliptical. This is the case when the eigenvalues have the same magnitude. Thus a measure of the isotropy around a local region is defined as the following:

where denote eigenvalues. This measure has the range . A value of corresponds to perfect isotropy.

Iterative algorithm

Using this mathematical framework, the Harris affine detector algorithm iteratively discovers the second-moment matrix that transforms the anisotropic region into a normalized region in which the isotropic measure is sufficiently close to one. The algorithm uses this shape adaptation matrix, , to transform the image into a normalized reference frame. In this normalized space, the interest points' parameters (spatial location, integration scale and differentiation scale) are refined using methods similar to the Harris-Laplace detector. The second-moment matrix is computed in this normalized reference frame and should have an isotropic measure close to one at the final iteration. At every th iteration, each interest region is defined by several parameters that the algorithm must discover: the matrix, position , integration scale and differentiation scale . Because the detector computes the second-moment matrix in the transformed domain, it's convenient to denote this transformed position as where .

  1. The detector initializes the search space with points detected by the Harris-Laplace detector.
    and , , and are those from the Harris-Laplace detector.
  2. Apply the previous iteration shape adaptation matrix, to generate the normalized reference frame, . For the first iteration, you apply .
  3. Select the integration scale, , using a method similar to the Harris-Laplace detector. The scale is chosen as the scale that maximizes the Laplacian of Gaussian (LoG). The search space of the scales are those within two scale-spaces of the previous iterations scale.
    It's important to note that the integration scale in the space differs significantly than the non-normalized space. Therefore, it is necessary to search for the integration scale as opposed to using the scale in the non-normalized space.
  4. Select the differentiation scale, . In order to reduce the search space and degrees of freedom, the differentiation scale is taken to be related to the integration scale through a constant factor: . For obvious reasons, the constant factor is less than one. Mikolajczyk and Schmid (2001) note that a too small factor will make smoothing (integration) too significant in comparison to differentiation and a factor that's too large will not allow for the integration to average the covariance matrix. [9] It is common to choose . From this set, the chosen scale will maximize the isotropic measure .
    where is the second-moment matrix evaluated in the normalized reference frame. This maximization processes causes the eigenvalues to converge to the same value.
  5. Spatial Localization: Select the point that maximizes the Harris corner measure () within an 8-point neighborhood around the previous point.

    where is the second-moment matrix as defined above. The window is the set of 8-nearest neighbors of the previous iteration's point in the normalized reference frame.

    Because our spatial localization was done in the -normalized reference frame, the newly chosen point must be transformed back to the original reference frame. This is achieved by transforming a displacement vector and adding this to the previous point:

  6. As mentioned above, the square-root of the second-moment matrix defines the transformation matrix that generates the normalized reference frame. We thus need to save this matrix: . The transformation matrix is updated: . In order to ensure that the image gets sampled correctly and we are expanding the image in the direction of the least change (smallest eigenvalue), we fix the maximum eigenvalue: . Using this updating method, one can easily see that the final matrix takes the following form:
  7. If the stopping criterion is not met, continue to the next iteration at step 2. Because the algorithm iteratively solves for the matrix that transforms an anisotropic region into an isotropic region, it makes sense to stop when the isotropic measure, , is sufficiently close to its maximum value 1. Sufficiently close implies the following stopping condition:
    Mikolajczyk and Schmid (2004) had good success with .

Computation and implementation

The computational complexity of the Harris-Affine detector is broken into two parts: initial point detection and affine region normalization. The initial point detection algorithm, Harris-Laplace, has complexity where is the number of pixels in the image. The affine region normalization algorithm automatically detects the scale and estimates the shape adaptation matrix, . This process has complexity , where is the number of initial points, is the size of the search space for the automatic scale selection and is the number of iterations required to compute the matrix. [11]

Some methods exist to reduce the complexity of the algorithm at the expense of accuracy. One method is to eliminate the search in the differentiation scale step. Rather than choose a factor from a set of factors, the sped-up algorithm chooses the scale to be constant across iterations and points: . Although this reduction in search space might decrease the complexity, this change can severely effect the convergence of the matrix.

Analysis

Convergence

One can imagine that this algorithm might identify duplicate interest points at multiple scales. Because the Harris affine algorithm looks at each initial point given by the Harris-Laplace detector independently, there is no discrimination between identical points. In practice, it has been shown that these points will ultimately all converge to the same interest point. After finishing identifying all interest points, the algorithm accounts for duplicates by comparing the spatial coordinates (), the integration scale , the isotropic measure and skew. [11] If these interest point parameters are similar within a specified threshold, then they are labeled duplicates. The algorithm discards all these duplicate points except for the interest point that's closest to the average of the duplicates. Typically 30% of the Harris affine points are distinct and dissimilar enough to not be discarded. [11]

Mikolajczyk and Schmid (2004) showed that often the initial points (40%) do not converge. The algorithm detects this divergence by stopping the iterative algorithm if the inverse of the isotropic measure is larger than a specified threshold: . Mikolajczyk and Schmid (2004) use . Of those that did converge, the typical number of required iterations was 10. [2]

Quantitative measure

Quantitative analysis of affine region detectors take into account both the accuracy of point locations and the overlap of regions across two images. Mioklajcyzk and Schmid (2004) extend the repeatability measure of Schmid et al. (1998) as the ratio of point correspondences to minimum detected points of the two images. [11] [13]

where are the number of corresponding points in images and . and are the number of detected points in the respective images. Because each image represents 3D space, it might be the case that the one image contains objects that are not in the second image and thus whose interest points have no chance of corresponding. In order to make the repeatability measure valid, one remove these points and must only consider points that lie in both images; and only count those points such that . For a pair of two images related through a homography matrix , two points, and are said to correspond if:

Overlap region of two elliptical regions. Overlap region.svg
Overlap region of two elliptical regions.
  1. Error in pixel location is less than 1.5 pixels:
  2. The overlap error of the two affine points () must be less than a specified threshold (typically 40%). [1] For affine regions, this overlap error is the following:

    where and are the recovered elliptical regions whose points satisfy: . Basically, this measure takes a ratio of areas: the area of overlap (intersection) and the total area (union). Perfect overlap would have a ratio of one and have an . Different scales effect the region of overlap and thus must be taken into account by normalizing the area of each region of interest. Regions with an overlap error as high as 50% are viable detectors to be matched with a good descriptor. [1]

    A second measure, a matching score, more practically assesses the detector's ability to identify matching points between images. Mikolajczyk and Schmid (2005) use a SIFT descriptor to identify matching points. In addition to being the closest points in SIFT-space, two matched points must also have a sufficiently small overlap error (as defined in the repeatability measure). The matching score is the ratio of the number of matched points and the minimum of the total detected points in each image:

    , [1]
    where are the number of matching points and and are the number of detected regions in the respective images.

Robustness to affine and other transformations

Mikolajczyk et al. (2005) have done a thorough analysis of several state-of-the-art affine region detectors: Harris affine, Hessian affine, MSER, [14] IBR & EBR [15] and salient [16] detectors. [1] Mikolajczyk et al. analyzed both structured images and textured images in their evaluation. Linux binaries of the detectors and their test images are freely available at their webpage. A brief summary of the results of Mikolajczyk et al. (2005) follow; see A comparison of affine region detectors for a more quantitative analysis.

Applications

Software packages

See also

Related Research Articles

<span class="mw-page-title-main">Normal distribution</span> Probability distribution

In statistics, a normal distribution or Gaussian distribution is a type of continuous probability distribution for a real-valued random variable. The general form of its probability density function is

In particle physics, the Dirac equation is a relativistic wave equation derived by British physicist Paul Dirac in 1928. In its free form, or including electromagnetic interactions, it describes all spin-12 massive particles, called "Dirac particles", such as electrons and quarks for which parity is a symmetry. It is consistent with both the principles of quantum mechanics and the theory of special relativity, and was the first theory to account fully for special relativity in the context of quantum mechanics. It was validated by accounting for the fine structure of the hydrogen spectrum in a completely rigorous way.

<span class="mw-page-title-main">Multivariate normal distribution</span> Generalization of the one-dimensional normal distribution to higher dimensions

In probability theory and statistics, the multivariate normal distribution, multivariate Gaussian distribution, or joint normal distribution is a generalization of the one-dimensional (univariate) normal distribution to higher dimensions. One definition is that a random vector is said to be k-variate normally distributed if every linear combination of its k components has a univariate normal distribution. Its importance derives mainly from the multivariate central limit theorem. The multivariate normal distribution is often used to describe, at least approximately, any set of (possibly) correlated real-valued random variables each of which clusters around a mean value.

<span class="mw-page-title-main">Covariance matrix</span> Measure of covariance of components of a random vector

In probability theory and statistics, a covariance matrix is a square matrix giving the covariance between each pair of elements of a given random vector.

In statistics, sometimes the covariance matrix of a multivariate random variable is not known but has to be estimated. Estimation of covariance matrices then deals with the question of how to approximate the actual covariance matrix on the basis of a sample from the multivariate distribution. Simple cases, where observations are complete, can be dealt with by using the sample covariance matrix. The sample covariance matrix (SCM) is an unbiased and efficient estimator of the covariance matrix if the space of covariance matrices is viewed as an extrinsic convex cone in Rp×p; however, measured using the intrinsic geometry of positive-definite matrices, the SCM is a biased and inefficient estimator. In addition, if the random variable has a normal distribution, the sample covariance matrix has a Wishart distribution and a slightly differently scaled version of it is the maximum likelihood estimate. Cases involving missing data, heteroscedasticity, or autocorrelated residuals require deeper considerations. Another issue is the robustness to outliers, to which sample covariance matrices are highly sensitive.

The scale-invariant feature transform (SIFT) is a computer vision algorithm to detect, describe, and match local features in images, invented by David Lowe in 1999. Applications include object recognition, robotic mapping and navigation, image stitching, 3D modeling, gesture recognition, video tracking, individual identification of wildlife and match moving.

Differential entropy is a concept in information theory that began as an attempt by Claude Shannon to extend the idea of (Shannon) entropy, a measure of average (surprisal) of a random variable, to continuous probability distributions. Unfortunately, Shannon did not derive this formula, and rather just assumed it was the correct continuous analogue of discrete entropy, but it is not. The actual continuous version of discrete entropy is the limiting density of discrete points (LDDP). Differential entropy is commonly encountered in the literature, but it is a limiting case of the LDDP, and one that loses its fundamental association with discrete entropy.

<span class="mw-page-title-main">Corner detection</span> Approach used in computer vision systems

Corner detection is an approach used within computer vision systems to extract certain kinds of features and infer the contents of an image. Corner detection is frequently used in motion detection, image registration, video tracking, image mosaicing, panorama stitching, 3D reconstruction and object recognition. Corner detection overlaps with the topic of interest point detection.

Affine shape adaptation is a methodology for iteratively adapting the shape of the smoothing kernels in an affine group of smoothing kernels to the local image structure in neighbourhood region of a specific image point. Equivalently, affine shape adaptation can be accomplished by iteratively warping a local image patch with affine transformations while applying a rotationally symmetric filter to the warped image patches. Provided that this iterative process converges, the resulting fixed point will be affine invariant. In the area of computer vision, this idea has been used for defining affine invariant interest point operators as well as affine invariant texture analysis methods.

In statistics, the multivariate t-distribution is a multivariate probability distribution. It is a generalization to random vectors of the Student's t-distribution, which is a distribution applicable to univariate random variables. While the case of a random matrix could be treated within this structure, the matrix t-distribution is distinct and makes particular use of the matrix structure.

The ensemble Kalman filter (EnKF) is a recursive filter suitable for problems with a large number of variables, such as discretizations of partial differential equations in geophysical models. The EnKF originated as a version of the Kalman filter for large problems, and it is now an important data assimilation component of ensemble forecasting. EnKF is related to the particle filter but the EnKF makes the assumption that all probability distributions involved are Gaussian; when it is applicable, it is much more efficient than the particle filter.

In computer vision, speeded up robust features (SURF) is a patented local feature detector and descriptor. It can be used for tasks such as object recognition, image registration, classification, or 3D reconstruction. It is partly inspired by the scale-invariant feature transform (SIFT) descriptor. The standard version of SURF is several times faster than SIFT and claimed by its authors to be more robust against different image transformations than SIFT.

The Kadir–Brady saliency detector extracts features of objects in images that are distinct and representative. It was invented by Timor Kadir and J. Michael Brady in 2001 and an affine invariant version was introduced by Kadir and Brady in 2004 and a robust version was designed by Shao et al. in 2007.

The Hessian affine region detector is a feature detector used in the fields of computer vision and image analysis. Like other feature detectors, the Hessian affine detector is typically used as a preprocessing step to algorithms that rely on identifiable, characteristic interest points.

<span class="mw-page-title-main">Generalized chi-squared distribution</span>

In probability theory and statistics, the generalized chi-squared distribution is the distribution of a quadratic form of a multinormal variable, or a linear combination of different normal variables and squares of normal variables. Equivalently, it is also a linear sum of independent noncentral chi-square variables and a normal variable. There are several other such generalizations for which the same term is sometimes used; some of them are special cases of the family discussed here, for example the gamma distribution.

<span class="mw-page-title-main">Weyl equation</span> Relativistic wave equation describing massless fermions

In physics, particularly in quantum field theory, the Weyl equation is a relativistic wave equation for describing massless spin-1/2 particles called Weyl fermions. The equation is named after Hermann Weyl. The Weyl fermions are one of the three possible types of elementary fermions, the other two being the Dirac and the Majorana fermions.

<span class="mw-page-title-main">Relativistic Lagrangian mechanics</span> Mathematical formulation of special and general relativity

In theoretical physics, relativistic Lagrangian mechanics is Lagrangian mechanics applied in the context of special relativity and general relativity.

<span class="mw-page-title-main">Point-set registration</span>

In computer vision, pattern recognition, and robotics, point-set registration, also known as point-cloud registration or scan matching, is the process of finding a spatial transformation that aligns two point clouds. The purpose of finding such a transformation includes merging multiple data sets into a globally consistent model, and mapping a new measurement to a known data set to identify features or to estimate its pose. Raw 3D point cloud data are typically obtained from Lidars and RGB-D cameras. 3D point clouds can also be generated from computer vision algorithms such as triangulation, bundle adjustment, and more recently, monocular image depth estimation using deep learning. For 2D point set registration used in image processing and feature-based image registration, a point set may be 2D pixel coordinates obtained by feature extraction from an image, for example corner detection. Point cloud registration has extensive applications in autonomous driving, motion estimation and 3D reconstruction, object detection and pose estimation, robotic manipulation, simultaneous localization and mapping (SLAM), panorama stitching, virtual and augmented reality, and medical imaging.

Lagrangian field theory is a formalism in classical field theory. It is the field-theoretic analogue of Lagrangian mechanics. Lagrangian mechanics is used to analyze the motion of a system of discrete particles each with a finite number of degrees of freedom. Lagrangian field theory applies to continua and fields, which have an infinite number of degrees of freedom.

In statistics and machine learning, Gaussian process approximation is a computational method that accelerates inference tasks in the context of a Gaussian process model, most commonly likelihood evaluation and prediction. Like approximations of other models, they can often be expressed as additional assumptions imposed on the model, which do not correspond to any actual feature, but which retain its key properties while simplifying calculations. Many of these approximation methods can be expressed in purely linear algebraic or functional analytic terms as matrix or function approximations. Others are purely algorithmic and cannot easily be rephrased as a modification of a statistical model.

References

  1. 1 2 3 4 5 6 K. Mikolajczyk, T. Tuytelaars, C. Schmid, A. Zisserman, J. Matas, F. Schaffalitzky, T. Kadir and L. Van Gool, A comparison of affine region detectors. In IJCV 65(1/2):43-72, 2005
  2. 1 2 Mikolajcyk, K. and Schmid, C. 2002. An affine invariant interest point detector. In Proceedings of the 8th International Conference on Computer Vision, Vancouver, Canada.
  3. 1 2 T. Lindeberg and J. Garding (1997). "Shape-adapted smoothing in estimation of 3-{D} depth cues from affine distortions of local 2-{D} structure". Image and Vision Computing 15: pp 415434.
  4. A. Baumberg (2000). "Reliable feature matching across widely separated views". Proceedings of IEEE Conference on Computer Vision and Pattern Recognition: pages I:17741781.
  5. Lindeberg, Tony, Scale-Space Theory in Computer Vision, Kluwer Academic Publishers, 1994, ISBN   0-7923-9418-6
  6. 1 2 3 T. Lindeberg (1998). "Feature detection with automatic scale selection". International Journal of Computer Vision 30 (2): pp 77116.
  7. Lindeberg, T. (2008). "Scale-space". In Wah, Benjamin (ed.). Encyclopedia of Computer Science and Engineering. Vol. IV. John Wiley and Sons. pp. 2495–2504. doi:10.1002/9780470050118.ecse609. ISBN   978-0470050118.
  8. 1 2 C. Harris and M. Stephens (1988). "A combined corner and edge detector". Proceedings of the 4th Alvey Vision Conference: pages 147151. Archived 2007-09-16 at the Wayback Machine
  9. 1 2 3 K. Mikolajczyk and C. Schmid. Indexing based on scale invariant interest points. In Proceedings of the 8th International Conference on Computer Vision, Vancouver, Canada, pages 525-531, 2001.
  10. Schmid, C., Mohr, R., and Bauckhage, C. 2000. Evaluation of interest point detectors. International Journal of Computer Vision, 37(2):151-172.
  11. 1 2 3 4 5 6 Mikolajczyk, K. and Schmid, C. 2004. Scale & affine invariant interest point detectors. International Journal on Computer Vision 60(1):63-86.
  12. Spatial Filters: Laplacian/Laplacian of Gaussian
  13. C. Schmid, R. Mohr, and C. Bauckhage. Comparing and evaluating interest points. In International Conference on Computer Vision, pp. 230-135, 1998.
  14. J.Matas, O. Chum, M. Urban, and T. Pajdla, Robust wide baseline stereo from maximally stable extremal regions. In BMVC p. 384-393, 2002.
  15. T. Tuytelaars and L. Van Gool, Matching widely separated views based on affine invariant regions. In IJCV 59(1):61-85, 2004.
  16. T. Kadir, A. Zisserman, and M. Brady, An affine invariant salient region detector. In ECCV p. 404-416, 2004.
  17. http://staff.science.uva.nl/~gevers/pub/overview.pdf [ bare URL PDF ]
  18. R. Datta, J. Li, and J. Z. Wang, “Content-based image retrieval - Approaches and trends of the new age,” In Proc. Int. Workshop on Multimedia Information Retrieval, pp. 253-262, 2005.IEEE Transactions on Multimedia, vol. 7, no. 1, pp. 127-142, 2005. Archived 2007-09-28 at the Wayback Machine
  19. J. Sivic and A. Zisserman. Video google: A text retrieval approach to object matching in videos. In Proceedings of the International Conference on Computer Vision, Nice, France, 2003.
  20. J. Sivic and A. Zisserman. Video data mining using configurations of viewpoint invariant regions. In Proceedings of the IEEE Conference on Computer Vision and Pattern Recognition, Washington DC, USA, pp. 488-495, 2004.
  21. G. Dorko and C. Schmid. Selection of scale invariant neighborhoods for object class recognition. In Proceedings of International Conference on Computer Vision, Nice, France, pp. 634-640, 2003.
  22. Beril Sirmacek and Cem Unsalan (January 2011). "A probabilistic framework to detect buildings in aerial and satellite images" (PDF). IEEE Transactions on Geoscience and Remote Sensing. 49 (1): 211–221. Bibcode:2011ITGRS..49..211S. doi:10.1109/TGRS.2010.2053713. S2CID   10637950.