Histogram matching

Last updated
An example of histogram matching Histmatching.svg
An example of histogram matching

In image processing, histogram matching or histogram specification is the transformation of an image so that its histogram matches a specified histogram. [1] The well-known histogram equalization method is a special case in which the specified histogram is uniformly distributed. [2]

Contents

It is possible to use histogram matching to balance detector responses as a relative detector calibration technique. It can be used to normalize two images, when the images were acquired at the same local illumination (such as shadows) over the same location, but by different sensors, atmospheric conditions or global illumination.

Implementation

Consider a grayscale input image X. It has a probability density function pr(r), where r is a grayscale value, and pr(r) is the probability of that value. This probability can easily be computed from the histogram of the image by

Where nj is the frequency of the grayscale value rj, and n is the total number of pixels in the image.

Now consider a desired output probability density function pz(z). A transformation of pr(r) is needed to convert it to pz(z).

Input image CDF matched to desired output CDF Histogram Matching.jpg
Input image CDF matched to desired output CDF

Each pdf (probability density function) can easily be mapped to its cumulative distribution function by

Where L is the total number of gray level (256 for a standard image).

The idea is to map each r value in X to the z value that has the same probability in the desired pdf. I.e. S(rj) = G(zi) or z = G−1(S(r)). [3]

Example

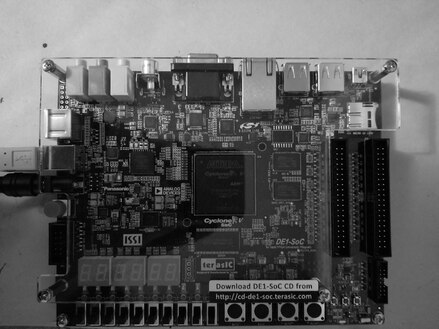
The following input grayscale image is to be changed to match the reference histogram.

Grayscale Image.tif

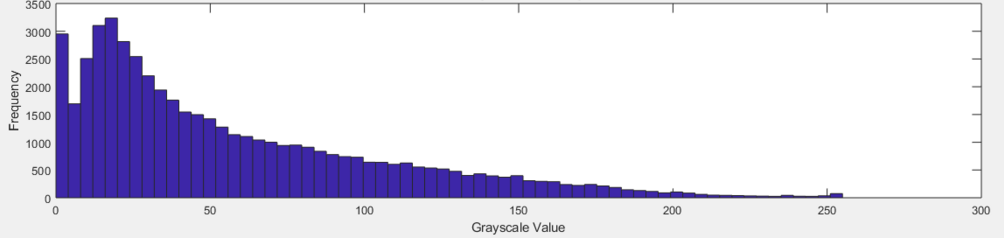
The input image has the following histogram

Histogram of input image Input Image Histogram.png
Histogram of input image

It will be matched to this reference histogram to emphasize the lower gray levels.

Desired reference histogram Ref h.png
Desired reference histogram

After matching, the output image has the following histogram

Histogram of output image after matching Output Image Histogram.png
Histogram of output image after matching

And looks like this

Output image after histogram matching Output image.tif
Output image after histogram matching

Algorithm

Given two images, the reference and the target images, we compute their histograms. Following, we calculate the cumulative distribution functions of the two images' histograms – for the reference image and for the target image. Then for each gray level , we find the gray level for which , and this is the result of histogram matching function: . Finally, we apply the function on each pixel of the reference image.

Exact histogram matching

In typical real-world applications, with 8-bit pixel values (discrete values in range [0, 255]), histogram matching can only approximate the specified histogram. All pixels of a particular value in the original image must be transformed to just one value in the output image.

Exact histogram matching is the problem of finding a transformation for a discrete image so that its histogram exactly matches the specified histogram. [4] Several techniques have been proposed for this. One simplistic approach converts the discrete-valued image into a continuous-valued image and adds small random values to each pixel so their values can be ranked without ties. However, this introduces noise to the output image.

Because of this there may be holes or open spots in the output matched histogram.

Multiple histogram matching

The histogram matching algorithm can be extended to find a monotonic mapping between two sets of histograms. Given two sets of histograms and , the optimal monotonic color mapping is calculated to minimize the distance between the two sets simultaneously, namely where is a distance metric between two histograms. The optimal solution is calculated using dynamic programming. [5]

See also

Related Research Articles

Histogram Graphical representation of the distribution of numerical data

A histogram is an approximate representation of the distribution of numerical data. It was first introduced by Karl Pearson. To construct a histogram, the first step is to "bin" the range of values—that is, divide the entire range of values into a series of intervals—and then count how many values fall into each interval. The bins are usually specified as consecutive, non-overlapping intervals of a variable. The bins (intervals) must be adjacent and are often of equal size.

Digital image processing is the use of a digital computer to process digital images through an algorithm. As a subcategory or field of digital signal processing, digital image processing has many advantages over analog image processing. It allows a much wider range of algorithms to be applied to the input data and can avoid problems such as the build-up of noise and distortion during processing. Since images are defined over two dimensions digital image processing may be modeled in the form of multidimensional systems. The generation and development of digital image processing are mainly affected by three factors: first, the development of computers; second, the development of mathematics ; third, the demand for a wide range of applications in environment, agriculture, military, industry and medical science has increased.

Order statistic

In statistics, the kth order statistic of a statistical sample is equal to its kth-smallest value. Together with rank statistics, order statistics are among the most fundamental tools in non-parametric statistics and inference.

Image segmentation partitioning a digital image into segments

In digital image processing and computer vision, image segmentation is the process of partitioning a digital image into multiple image segments, also known as image regions or image objects. The goal of segmentation is to simplify and/or change the representation of an image into something that is more meaningful and easier to analyze. Image segmentation is typically used to locate objects and boundaries in images. More precisely, image segmentation is the process of assigning a label to every pixel in an image such that pixels with the same label share certain characteristics.

The scale-invariant feature transform (SIFT) is a computer vision algorithm to detect, describe, and match local features in images, invented by David Lowe in 1999. Applications include object recognition, robotic mapping and navigation, image stitching, 3D modeling, gesture recognition, video tracking, individual identification of wildlife and match moving.

Thresholding (image processing) Image segmentation algorithm

In digital image processing, thresholding is the simplest method of segmenting images. From a grayscale image, thresholding can be used to create binary images.

Otsus method In computer vision and image processing

In computer vision and image processing, Otsu's method, named after Nobuyuki Otsu, is used to perform automatic image thresholding. In the simplest form, the algorithm returns a single intensity threshold that separate pixels into two classes, foreground and background. This threshold is determined by minimizing intra-class intensity variance, or equivalently, by maximizing inter-class variance. Otsu's method is a one-dimensional discrete analog of Fisher's Discriminant Analysis, is related to Jenks optimization method, and is equivalent to a globally optimal k-means performed on the intensity histogram. The extension to multi-level thresholding was described in the original paper, and computationally efficient implementations have since been proposed.

Histogram equalization method in image processing of contrast adjustment using the images histogram

Histogram equalization is a method in image processing of contrast adjustment using the image's histogram.

A co-occurrence matrix or co-occurrence distribution is a matrix that is defined over an image to be the distribution of co-occurring pixel values at a given offset. It is used as an approach to texture analysis with various applications especially in medical image analysis.

The softmax function, also known as softargmax or normalized exponential function, is a generalization of the logistic function to multiple dimensions. It is used in multinomial logistic regression and is often used as the last activation function of a neural network to normalize the output of a network to a probability distribution over predicted output classes, based on Luce's choice axiom.

In statistics, the earth mover's distance (EMD) is a measure of the distance between two probability distributions over a region D. In mathematics, this is known as the Wasserstein metric. Informally, if the distributions are interpreted as two different ways of piling up a certain amount of earth (dirt) over the region D, the EMD is the minimum cost of turning one pile into the other; where the cost is assumed to be the amount of dirt moved times the distance by which it is moved.

Shape context is a feature descriptor used in object recognition. Serge Belongie and Jitendra Malik proposed the term in their paper "Matching with Shape Contexts" in 2000.

Region growing is a simple region-based image segmentation method. It is also classified as a pixel-based image segmentation method since it involves the selection of initial seed points.

The random walker algorithm is an algorithm for image segmentation. In the first description of the algorithm, a user interactively labels a small number of pixels with known labels, e.g., "object" and "background". The unlabeled pixels are each imagined to release a random walker, and the probability is computed that each pixel's random walker first arrives at a seed bearing each label, i.e., if a user places K seeds, each with a different label, then it is necessary to compute, for each pixel, the probability that a random walker leaving the pixel will first arrive at each seed. These probabilities may be determined analytically by solving a system of linear equations. After computing these probabilities for each pixel, the pixel is assigned to the label for which it is most likely to send a random walker. The image is modeled as a graph, in which each pixel corresponds to a node which is connected to neighboring pixels by edges, and the edges are weighted to reflect the similarity between the pixels. Therefore, the random walk occurs on the weighted graph.

Image texture

An image texture is a set of metrics calculated in image processing designed to quantify the perceived texture of an image. Image texture gives us information about the spatial arrangement of color or intensities in an image or selected region of an image.

Kernel density estimation is a nonparametric technique for density estimation i.e., estimation of probability density functions, which is one of the fundamental questions in statistics. It can be viewed as a generalisation of histogram density estimation with improved statistical properties. Apart from histograms, other types of density estimators include parametric, spline, wavelet and Fourier series. Kernel density estimators were first introduced in the scientific literature for univariate data in the 1950s and 1960s and subsequently have been widely adopted. It was soon recognised that analogous estimators for multivariate data would be an important addition to multivariate statistics. Based on research carried out in the 1990s and 2000s, multivariate kernel density estimation has reached a level of maturity comparable to its univariate counterparts.

Color normalization is a topic in computer vision concerned with artificial color vision and object recognition. In general, the distribution of color values in an image depends on the illumination, which may vary depending on lighting conditions, cameras, and other factors. Color normalization allows for object recognition techniques based on color to compensate for these variations.

Integral Channel Features (ICF), also known as ChnFtrs, is a method for object detection in computer vision. It uses integral images to extract features such as local sums, histograms and Haar-like features from multiple registered image channels. This method was highly exploited by Dollár et al. in their work for pedestrian detection, that was first described at the BMVC in 2009.

In computer science, quantum image processing (QIP) is primarily used in quantum computing and quantum information processing to create and work with quantum images.

Semi-global matching (SGM) is a computer vision algorithm for the estimation of a dense disparity map from a rectified stereo image pair, introduced in 2005 by Heiko Hirschmüller while working at the German Aerospace Center. Given its predictable run time, its favourable trade-off between quality of the results and computing time, and its suitability for fast parallel implementation in ASIC or FPGA, it has encountered wide adoption in real-time stereo vision applications such as robotics and advanced driver assistance systems.

References

  1. Gonzalez, Rafael C.; Woods, Richard E. (2008). Digital Image Processing (3rd ed.). Prentice Hall. p. 128. ISBN   9780131687288.
  2. Gonzalez, R.C.; Fittes, B.A. (June 9–11, 1975). Gray-level transformations for interactive image enhancement (PDF). 2nd Conference on Remotely Manned Systems: Technology and Applications. Los Angeles, California. pp. 17–19.
  3. Gonzalez, Rafael (2017). Digital image processing 4th Edition. London: Pearson. pp. 94–103. ISBN   978-0133356724.
  4. Coltuc, Dinu; Bolon, Philippe; Chassery, Jean-Marc (May 2006). "Exact Histogram Specification". IEEE Transactions on Image Processing. 15 (5): 1143–52. Bibcode:2006ITIP...15.1143C. doi:10.1109/TIP.2005.864170. PMID   16671295. S2CID   16060881.
  5. Shapira D.; Avidan S.; Hel-Or Y. (2013). "Multiple Histogram Matching" (PDF). Proceedings of the IEEE International Conference on Image Processing.