
A histogram is an approximate representation of the distribution of numerical data. The term was first introduced by Karl Pearson. To construct a histogram, the first step is to "bin" the range of values—that is, divide the entire range of values into a series of intervals—and then count how many values fall into each interval. The bins are usually specified as consecutive, non-overlapping intervals of a variable. The bins (intervals) must be adjacent and are often of equal size.

Halftone is the reprographic technique that simulates continuous-tone imagery through the use of dots, varying either in size or in spacing, thus generating a gradient-like effect. "Halftone" can also be used to refer specifically to the image that is produced by this process.
In image processing and photography, a color histogram is a representation of the distribution of colors in an image. For digital images, a color histogram represents the number of pixels that have colors in each of a fixed list of color ranges, that span the image's color space, the set of all possible colors.

The Canny edge detector is an edge detection operator that uses a multi-stage algorithm to detect a wide range of edges in images. It was developed by John F. Canny in 1986. Canny also produced a computational theory of edge detection explaining why the technique works.
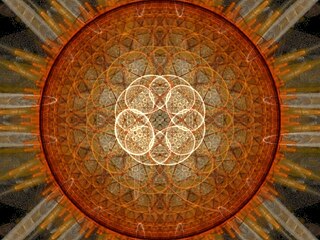
Fractal flames are a member of the iterated function system class of fractals created by Scott Draves in 1992. Draves' open-source code was later ported into Adobe After Effects graphics software and translated into the Apophysis fractal flame editor.

In digital image processing and computer vision, image segmentation is the process of partitioning a digital image into multiple image segments, also known as image regions or image objects. The goal of segmentation is to simplify and/or change the representation of an image into something that is more meaningful and easier to analyze. Image segmentation is typically used to locate objects and boundaries in images. More precisely, image segmentation is the process of assigning a label to every pixel in an image such that pixels with the same label share certain characteristics.
In machine learning and pattern recognition, a feature is an individual measurable property or characteristic of a phenomenon. Choosing informative, discriminating and independent features is a crucial element of effective algorithms in pattern recognition, classification and regression. Features are usually numeric, but structural features such as strings and graphs are used in syntactic pattern recognition. The concept of "feature" is related to that of explanatory variable used in statistical techniques such as linear regression.

In digital image processing, thresholding is the simplest method of segmenting images. From a grayscale image, thresholding can be used to create binary images.

Tone mapping is a technique used in image processing and computer graphics to map one set of colors to another to approximate the appearance of high-dynamic-range images in a medium that has a more limited dynamic range. Print-outs, CRT or LCD monitors, and projectors all have a limited dynamic range that is inadequate to reproduce the full range of light intensities present in natural scenes. Tone mapping addresses the problem of strong contrast reduction from the scene radiance to the displayable range while preserving the image details and color appearance important to appreciate the original scene content.

Histogram equalization is a method in image processing of contrast adjustment using the image's histogram.

In digital photography, exposing to the right (ETTR) is the technique of adjusting the exposure of an image as high as possible at base ISO to collect the maximum amount of light and thus get the optimum performance out of the digital image sensor.

Error diffusion is a type of halftoning in which the quantization residual is distributed to neighboring pixels that have not yet been processed. Its main use is to convert a multi-level image into a binary image, though it has other applications.

Ordered dithering is an image dithering algorithm. It is commonly used to display a continuous image on a display of smaller color depth. For example, Microsoft Windows uses it in 16-color graphics modes. The algorithm is characterized by noticeable crosshatch patterns in the result.
Adaptive histogram equalization (AHE) is a computer image processing technique used to improve contrast in images. It differs from ordinary histogram equalization in the respect that the adaptive method computes several histograms, each corresponding to a distinct section of the image, and uses them to redistribute the lightness values of the image. It is therefore suitable for improving the local contrast and enhancing the definitions of edges in each region of an image.
Data binning, also called data discrete binning or data bucketing, is a data pre-processing technique used to reduce the effects of minor observation errors. The original data values which fall into a given small interval, a bin, are replaced by a value representative of that interval, often a central value. It is related to quantization: data binning operates on the abscissa axis while quantization operates on the ordinate axis. Binning is a generalization of rounding.

RawTherapee is application software for processing photographs in raw image formats, as created by many digital cameras. It comprises a subset of image editing operations specifically aimed at non-destructive post-production of raw photos and is primarily focused on improving a photographer's workflow by facilitating the handling of large numbers of images. It is notable for the advanced control it gives the user over the demosaicing and developing process. It is cross-platform, with versions for Microsoft Windows, macOS and Linux.

In image processing, histogram matching or histogram specification is the transformation of an image so that its histogram matches a specified histogram. The well-known histogram equalization method is a special case in which the specified histogram is uniformly distributed.

Image editing encompasses the processes of altering images, whether they are digital photographs, traditional photo-chemical photographs, or illustrations. Traditional analog image editing is known as photo retouching, using tools such as an airbrush to modify photographs or editing illustrations with any traditional art medium. Graphic software programs, which can be broadly grouped into vector graphics editors, raster graphics editors, and 3D modelers, are the primary tools with which a user may manipulate, enhance, and transform images. Many image editing programs are also used to render or create computer art from scratch. The term “image editing” usually refers only to the editing of 2D images, not 3D ones.
Color normalization is a topic in computer vision concerned with artificial color vision and object recognition. In general, the distribution of color values in an image depends on the illumination, which may vary depending on lighting conditions, cameras, and other factors. Color normalization allows for object recognition techniques based on color to compensate for these variations.
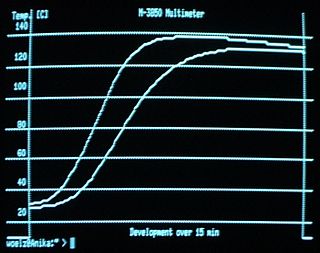
Waveform graphics is a simple vector graphics system introduced by Digital Equipment Corporation (DEC) on the VT55 and VT105 terminals in the mid-1970s. It was used to produce graphics output from mainframes and minicomputers. DEC used the term "waveform graphics" to refer specifically to the hardware, but it was used more generally to describe the whole system.

