In the mathematical subfield of numerical analysis, an I-spline [1] [2] is a monotone spline function.
Contents

In the mathematical subfield of numerical analysis, an I-spline [1] [2] is a monotone spline function.
A family of I-spline functions of degree k with n free parameters is defined in terms of the M-splines Mi(x|k, t)
where L is the lower limit of the domain of the splines.
Since M-splines are non-negative, I-splines are monotonically non-decreasing.
Let j be the index such that tj ≤ x < tj+1. Then Ii(x|k, t) is zero if i > j, and equals one if j − k + 1 > i. Otherwise,
I-splines can be used as basis splines for regression analysis and data transformation when monotonicity is desired (constraining the regression coefficients to be non-negative for a non-decreasing fit, and non-positive for a non-increasing fit).

In the mathematical subfield of numerical analysis, a B-spline or basis spline is a spline function that has minimal support with respect to a given degree, smoothness, and domain partition. Any spline function of given degree can be expressed as a linear combination of B-splines of that degree. Cardinal B-splines have knots that are equidistant from each other. B-splines can be used for curve-fitting and numerical differentiation of experimental data.

In mathematics, a monotonic function is a function between ordered sets that preserves or reverses the given order. This concept first arose in calculus, and was later generalized to the more abstract setting of order theory.

The method of least squares is a standard approach in regression analysis to approximate the solution of overdetermined systems by minimizing the sum of the squares of the residuals made in the results of each individual equation.
In the mathematical field of real analysis, the monotone convergence theorem is any of a number of related theorems proving the convergence of monotonic sequences that are also bounded. Informally, the theorems state that if a sequence is increasing and bounded above by a supremum, then the sequence will converge to the supremum; in the same way, if a sequence is decreasing and is bounded below by an infimum, it will converge to the infimum.

In statistics, the logistic model is a statistical model that models the probability of an event taking place by having the log-odds for the event be a linear combination of one or more independent variables. In regression analysis, logistic regression is estimating the parameters of a logistic model. Formally, in binary logistic regression there is a single binary dependent variable, coded by an indicator variable, where the two values are labeled "0" and "1", while the independent variables can each be a binary variable or a continuous variable. The corresponding probability of the value labeled "1" can vary between 0 and 1, hence the labeling; the function that converts log-odds to probability is the logistic function, hence the name. The unit of measurement for the log-odds scale is called a logit, from logistic unit, hence the alternative names. See § Background and § Definition for formal mathematics, and § Example for a worked example.
In mathematics, Fatou's lemma establishes an inequality relating the Lebesgue integral of the limit inferior of a sequence of functions to the limit inferior of integrals of these functions. The lemma is named after Pierre Fatou.
Curve fitting is the process of constructing a curve, or mathematical function, that has the best fit to a series of data points, possibly subject to constraints. Curve fitting can involve either interpolation, where an exact fit to the data is required, or smoothing, in which a "smooth" function is constructed that approximately fits the data. A related topic is regression analysis, which focuses more on questions of statistical inference such as how much uncertainty is present in a curve that is fit to data observed with random errors. Fitted curves can be used as an aid for data visualization, to infer values of a function where no data are available, and to summarize the relationships among two or more variables. Extrapolation refers to the use of a fitted curve beyond the range of the observed data, and is subject to a degree of uncertainty since it may reflect the method used to construct the curve as much as it reflects the observed data.

In statistics, nonlinear regression is a form of regression analysis in which observational data are modeled by a function which is a nonlinear combination of the model parameters and depends on one or more independent variables. The data are fitted by a method of successive approximations.

In statistics and numerical analysis, isotonic regression or monotonic regression is the technique of fitting a free-form line to a sequence of observations such that the fitted line is non-decreasing everywhere, and lies as close to the observations as possible.
In statistics, a generalized additive model (GAM) is a generalized linear model in which the linear response variable depends linearly on unknown smooth functions of some predictor variables, and interest focuses on inference about these smooth functions.
Nonparametric regression is a category of regression analysis in which the predictor does not take a predetermined form but is constructed according to information derived from the data. That is, no parametric form is assumed for the relationship between predictors and dependent variable. Nonparametric regression requires larger sample sizes than regression based on parametric models because the data must supply the model structure as well as the model estimates.
In statistics, the Durbin–Watson statistic is a test statistic used to detect the presence of autocorrelation at lag 1 in the residuals from a regression analysis. It is named after James Durbin and Geoffrey Watson. The small sample distribution of this ratio was derived by John von Neumann. Durbin and Watson applied this statistic to the residuals from least squares regressions, and developed bounds tests for the null hypothesis that the errors are serially uncorrelated against the alternative that they follow a first order autoregressive process. Note that the distribution of this test statistic does not depend on the estimated regression coefficients and the variance of the errors.
In the mathematical field of numerical analysis, monotone cubic interpolation is a variant of cubic interpolation that preserves monotonicity of the data set being interpolated.

In probability and statistics, the log-logistic distribution is a continuous probability distribution for a non-negative random variable. It is used in survival analysis as a parametric model for events whose rate increases initially and decreases later, as, for example, mortality rate from cancer following diagnosis or treatment. It has also been used in hydrology to model stream flow and precipitation, in economics as a simple model of the distribution of wealth or income, and in networking to model the transmission times of data considering both the network and the software.
In the statistical area of survival analysis, an accelerated failure time model is a parametric model that provides an alternative to the commonly used proportional hazards models. Whereas a proportional hazards model assumes that the effect of a covariate is to multiply the hazard by some constant, an AFT model assumes that the effect of a covariate is to accelerate or decelerate the life course of a disease by some constant. This is especially appealing in a technical context where the 'disease' is a result of some mechanical process with a known sequence of intermediary stages.
In statistics, multivariate adaptive regression splines (MARS) is a form of regression analysis introduced by Jerome H. Friedman in 1991. It is a non-parametric regression technique and can be seen as an extension of linear models that automatically models nonlinearities and interactions between variables.
In statistics, polynomial regression is a form of regression analysis in which the relationship between the independent variable x and the dependent variable y is modelled as an nth degree polynomial in x. Polynomial regression fits a nonlinear relationship between the value of x and the corresponding conditional mean of y, denoted E(y |x). Although polynomial regression fits a nonlinear model to the data, as a statistical estimation problem it is linear, in the sense that the regression function E(y | x) is linear in the unknown parameters that are estimated from the data. For this reason, polynomial regression is considered to be a special case of multiple linear regression.
In the mathematical field of analysis, a well-known theorem describes the set of discontinuities of a monotone real-valued function of a real variable; all discontinuities of such a (monotone) function are necessarily jump discontinuities and there are at most countably many of them.
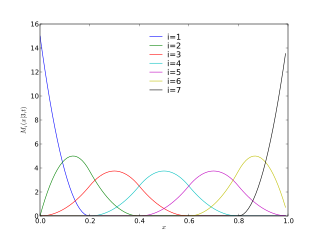
In the mathematical subfield of numerical analysis, an M-spline is a non-negative spline function.
In statistics, the class of vector generalized linear models (VGLMs) was proposed to enlarge the scope of models catered for by generalized linear models (GLMs). In particular, VGLMs allow for response variables outside the classical exponential family and for more than one parameter. Each parameter can be transformed by a link function. The VGLM framework is also large enough to naturally accommodate multiple responses; these are several independent responses each coming from a particular statistical distribution with possibly different parameter values.
| | This applied mathematics-related article is a stub. You can help Wikipedia by expanding it. |

