In the mathematical subfield of numerical analysis, an M-spline [1] [2] is a non-negative spline function.
Contents

In the mathematical subfield of numerical analysis, an M-spline [1] [2] is a non-negative spline function.
A family of M-spline functions of order k with n free parameters is defined by a set of knots t1 ≤ t2 ≤ ... ≤ tn+k such that
The family includes n members indexed by i = 1,...,n.
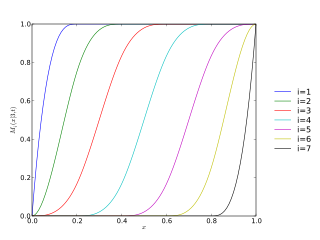
An M-splineMi(x|k, t) has the following mathematical properties
M-splines can be efficiently and stably computed using the following recursions:
For k = 1,
if ti ≤ x < ti+1, and Mi(x|1,t) = 0 otherwise.
For k > 1,
M-splines can be integrated to produce a family of monotone splines called I-splines. M-splines can also be used directly as basis splines for regression analysis involving positive response data (constraining the regression coefficients to be non-negative).

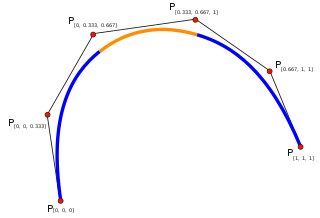
In the mathematical subfield of numerical analysis, a B-spline or basis spline is a spline function that has minimal support with respect to a given degree, smoothness, and domain partition. Any spline function of given degree can be expressed as a linear combination of B-splines of that degree. Cardinal B-splines have knots that are equidistant from each other. B-splines can be used for curve-fitting and numerical differentiation of experimental data.

In the branch of mathematics known as real analysis, the Riemann integral, created by Bernhard Riemann, was the first rigorous definition of the integral of a function on an interval. It was presented to the faculty at the University of Göttingen in 1854, but not published in a journal until 1868. For many functions and practical applications, the Riemann integral can be evaluated by the fundamental theorem of calculus or approximated by numerical integration, or simulated using Monte Carlo integration.

In statistics, the logistic model is a statistical model that models the probability of an event taking place by having the log-odds for the event be a linear combination of one or more independent variables. In regression analysis, logistic regression is estimating the parameters of a logistic model. Formally, in binary logistic regression there is a single binary dependent variable, coded by an indicator variable, where the two values are labeled "0" and "1", while the independent variables can each be a binary variable or a continuous variable. The corresponding probability of the value labeled "1" can vary between 0 and 1, hence the labeling; the function that converts log-odds to probability is the logistic function, hence the name. The unit of measurement for the log-odds scale is called a logit, from logistic unit, hence the alternative names. See § Background and § Definition for formal mathematics, and § Example for a worked example.

Non-uniform rational basis spline (NURBS) is a mathematical model using basis splines (B-splines) that is commonly used in computer graphics for representing curves and surfaces. It offers great flexibility and precision for handling both analytic and modeled shapes. It is a type of curve modeling, as opposed to polygonal modeling or digital sculpting. NURBS curves are commonly used in computer-aided design (CAD), manufacturing (CAM), and engineering (CAE). They are part of numerous industry-wide standards, such as IGES, STEP, ACIS, and PHIGS. Tools for creating and editing NURBS surfaces are found in various 3D graphics and animation software packages.
In mathematics, a spline is a special function defined piecewise by polynomials. In interpolating problems, spline interpolation is often preferred to polynomial interpolation because it yields similar results, even when using low degree polynomials, while avoiding Runge's phenomenon for higher degrees.
In the mathematical subfield of numerical analysis, de Boor's algorithm is a polynomial-time and numerically stable algorithm for evaluating spline curves in B-spline form. It is a generalization of de Casteljau's algorithm for Bézier curves. The algorithm was devised by German-American mathematician Carl R. de Boor. Simplified, potentially faster variants of the de Boor algorithm have been created but they suffer from comparatively lower stability.
In the mathematical field of numerical analysis, spline interpolation is a form of interpolation where the interpolant is a special type of piecewise polynomial called a spline. That is, instead of fitting a single, high-degree polynomial to all of the values at once, spline interpolation fits low-degree polynomials to small subsets of the values, for example, fitting nine cubic polynomials between each of the pairs of ten points, instead of fitting a single degree-nine polynomial to all of them. Spline interpolation is often preferred over polynomial interpolation because the interpolation error can be made small even when using low-degree polynomials for the spline. Spline interpolation also avoids the problem of Runge's phenomenon, in which oscillation can occur between points when interpolating using high-degree polynomials.

In statistical modeling, regression analysis is a set of statistical processes for estimating the relationships between a dependent variable and one or more independent variables. The most common form of regression analysis is linear regression, in which one finds the line that most closely fits the data according to a specific mathematical criterion. For example, the method of ordinary least squares computes the unique line that minimizes the sum of squared differences between the true data and that line. For specific mathematical reasons, this allows the researcher to estimate the conditional expectation of the dependent variable when the independent variables take on a given set of values. Less common forms of regression use slightly different procedures to estimate alternative location parameters or estimate the conditional expectation across a broader collection of non-linear models.

In statistics, nonlinear regression is a form of regression analysis in which observational data are modeled by a function which is a nonlinear combination of the model parameters and depends on one or more independent variables. The data are fitted by a method of successive approximations.

In mathematical analysis, the smoothness of a function is a property measured by the number of continuous derivatives it has over some domain, called differentiability class. At the very minimum, a function could be considered smooth if it is differentiable everywhere. At the other end, it might also possess derivatives of all orders in its domain, in which case it is said to be infinitely differentiable and referred to as a C-infinity function.
In mathematics, the square root of a matrix extends the notion of square root from numbers to matrices. A matrix B is said to be a square root of A if the matrix product BB is equal to A.
In the mathematical field of numerical analysis, monotone cubic interpolation is a variant of cubic interpolation that preserves monotonicity of the data set being interpolated.
In statistics, multivariate adaptive regression splines (MARS) is a form of regression analysis introduced by Jerome H. Friedman in 1991. It is a non-parametric regression technique and can be seen as an extension of linear models that automatically models nonlinearities and interactions between variables.
Smoothing splines are function estimates, , obtained from a set of noisy observations of the target , in order to balance a measure of goodness of fit of to with a derivative based measure of the smoothness of . They provide a means for smoothing noisy data. The most familiar example is the cubic smoothing spline, but there are many other possibilities, including for the case where is a vector quantity.
In statistics, polynomial regression is a form of regression analysis in which the relationship between the independent variable x and the dependent variable y is modelled as an nth degree polynomial in x. Polynomial regression fits a nonlinear relationship between the value of x and the corresponding conditional mean of y, denoted E(y |x). Although polynomial regression fits a nonlinear model to the data, as a statistical estimation problem it is linear, in the sense that the regression function E(y | x) is linear in the unknown parameters that are estimated from the data. For this reason, polynomial regression is considered to be a special case of multiple linear regression.
In the mathematical subfield of numerical analysis, an I-spline is a monotone spline function.
Isogeometric analysis is a computational approach that offers the possibility of integrating finite element analysis (FEA) into conventional NURBS-based CAD design tools. Currently, it is necessary to convert data between CAD and FEA packages to analyse new designs during development, a difficult task since the two computational geometric approaches are different. Isogeometric analysis employs complex NURBS geometry in the FEA application directly. This allows models to be designed, tested and adjusted in one go, using a common data set.

In computer graphics, the centripetal Catmull–Rom spline is a variant form of the Catmull–Rom spline, originally formulated by Edwin Catmull and Raphael Rom, which can be evaluated using a recursive algorithm proposed by Barry and Goldman. It is a type of interpolating spline defined by four control points , with the curve drawn only from to .
In the mathematical theory of wavelets, a spline wavelet is a wavelet constructed using a spline function. There are different types of spline wavelets. The interpolatory spline wavelets introduced by C.K. Chui and J.Z. Wang are based on a certain spline interpolation formula. Though these wavelets are orthogonal, they do not have compact supports. There is a certain class of wavelets, unique in some sense, constructed using B-splines and having compact supports. Even though these wavelets are not orthogonal they have some special properties that have made them quite popular. The terminology spline wavelet is sometimes used to refer to the wavelets in this class of spline wavelets. These special wavelets are also called B-spline wavelets and cardinal B-spline wavelets. The Battle-Lemarie wavelets are also wavelets constructed using spline functions.
In statistics, the class of vector generalized linear models (VGLMs) was proposed to enlarge the scope of models catered for by generalized linear models (GLMs). In particular, VGLMs allow for response variables outside the classical exponential family and for more than one parameter. Each parameter can be transformed by a link function. The VGLM framework is also large enough to naturally accommodate multiple responses; these are several independent responses each coming from a particular statistical distribution with possibly different parameter values.
| | This applied mathematics-related article is a stub. You can help Wikipedia by expanding it. |

