Related Research Articles

The Office of Management and Budget (OMB) is the largest office within the Executive Office of the President of the United States (EOP). OMB's most prominent function is to produce the president's budget, but it also examines agency programs, policies, and procedures to see whether they comply with the president's policies and coordinates inter-agency policy initiatives.
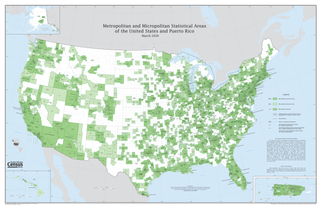
In the United States, a metropolitan statistical area (MSA) is a geographical region with a relatively high population density at its core and close economic ties throughout the area. Such regions are neither legally incorporated as a city or town would be, nor are they legal administrative divisions like counties or separate entities such as states; because of this, the precise definition of any given metropolitan area can vary with the source. The statistical criteria for a standard metropolitan area were defined in 1949 and redefined as metropolitan statistical area in 1983.
In the United States, federal assistance, also known as federal aid, federal benefits, or federal funds, is defined as any federal program, project, service, or activity provided by the federal government that directly assists domestic governments, organizations, or individuals in the areas of education, health, public safety, public welfare, and public works, among others.

In the United States, the Single Audit, Subpart F of the OMB Uniform Guidance, is a rigorous, organization-wide audit or examination of an entity that expends $750,000 or more of federal assistance received for its operations. Usually performed annually, the Single Audit's objective is to provide assurance to the US federal government as to the management and use of such funds by recipients such as states, cities, universities, non-profit organizations, and Indian Tribes. The audit is typically performed by an independent certified public accountant (CPA) and encompasses both financial and compliance components. The Single Audits must be submitted to the Federal Audit Clearinghouse along with a data collection form, Form SF-SAC.
In the United States, compliance requirements are a series of directives United States federal government agencies established that summarize hundreds of federal laws and regulations applicable to federal assistance. They are currently incorporated into the OMB A-133 Compliance Supplement, which was created by the US Office of Management and Budget (OMB).
The OMB A-133 Compliance Supplement is a large and extensive United States federal government guide created by the Office of Management and Budget (OMB) and used in auditing federal assistance and federal grant programs, as well as their respective recipients. It is considered to be the most important tool of an auditor for a Single Audit.
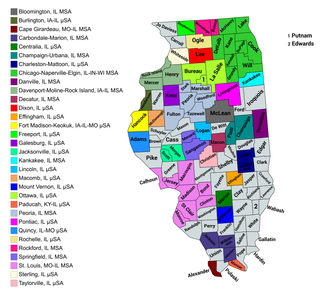
The U.S. State of Illinois currently has 43 statistical areas that have been delineated by the Office of Management and Budget (OMB). On March 6, 2020, the OMB delineated 11 combined statistical areas, 13 metropolitan statistical areas, and 19 micropolitan statistical areas in Illinois.
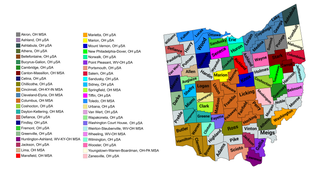
The U.S. State of Ohio currently has 57 statistical areas that have been delineated by the Office of Management and Budget (OMB). On March 6, 2020, the OMB delineated 11 combined statistical areas, 14 metropolitan statistical areas, and 32 micropolitan statistical areas in Ohio.
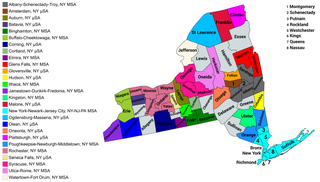
The U.S. State of New York currently has 34 statistical areas that have been delineated by the Office of Management and Budget (OMB). On March 6, 2020, the OMB delineated seven combined statistical areas, 14 metropolitan statistical areas, and 13 micropolitan statistical areas in New York.
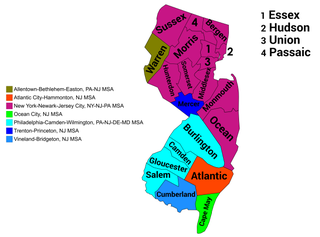
The U.S. State of New Jersey currently has nine statistical areas that have been delineated by the Office of Management and Budget (OMB). On March 6, 2020, the OMB delineated two combined statistical areas and seven metropolitan statistical areas in New Jersey. New Jersey is the most urban of the 50 U.S. states with the highest population density of any state. Each of the 21 counties of New Jersey is located in one of the seven metropolitan statistical areas.

The U.S. State of Tennessee currently has 34 statistical areas that have been delineated by the Office of Management and Budget (OMB). On March 6, 2020, the OMB delineated seven combined statistical areas, ten metropolitan statistical areas, and 17 micropolitan statistical areas in Tennessee.
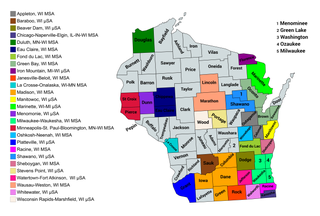
The U.S. State of Wisconsin currently has 36 statistical areas that have been delineated by the Office of Management and Budget (OMB). On March 6, 2020, the OMB delineated nine combined statistical areas, 15 metropolitan statistical areas, and 12 micropolitan statistical areas in Wisconsin.

The U.S. State of California currently has 39 statistical areas that have been delineated by the Office of Management and Budget (OMB). On March 6, 2020, the OMB delineated five combined statistical areas, 26 metropolitan statistical areas, and eight micropolitan statistical areas in California.

The U.S. State of Idaho currently has 20 statistical areas that have been delineated by the Office of Management and Budget (OMB). On March 6, 2020, the OMB delineated four combined statistical areas, seven metropolitan statistical areas, and nine micropolitan statistical areas in Idaho.

The United States Commonwealth of Virginia currently has 19 statistical areas that have been delineated by the Office of Management and Budget (OMB). On March 6, 2020, the OMB delineated four combined statistical areas, 11 metropolitan statistical areas, and four micropolitan statistical areas in Virginia.
The U.S. State of Maryland currently has 12 statistical areas that have been delineated by the Office of Management and Budget (OMB). On March 6, 2020, the OMB delineated three combined statistical areas, seven metropolitan statistical areas, and two micropolitan statistical areas in Maryland.

The U.S. State of Oregon currently has 24 statistical areas that have been delineated by the Office of Management and Budget (OMB). On March 6, 2020, the OMB delineated four combined statistical areas, eight metropolitan statistical areas, and 12 micropolitan statistical areas in Oregon.
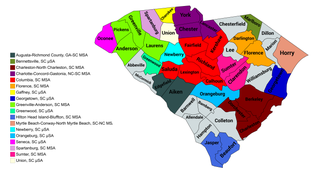
The U.S. State of South Carolina currently has 22 statistical areas that have been delineated by the Office of Management and Budget (OMB). On March 6, 2020, the OMB delineated four combined statistical areas, ten metropolitan statistical areas, and eight micropolitan statistical areas in South Carolina.
The Commonwealth of Puerto Rico currently has 15 statistical areas that have been delineated by the United States Office of Management and Budget (OMB). On March 6, 2020, the OMB delineated three combined statistical areas, eight metropolitan statistical areas, and four micropolitan statistical areas in Puerto Rico.
References
- ↑ Raines, F. D., Circular No. A-119 Revised, accessed 6 November 2022
- ↑ OMB, Circular No. A-131, published 21 May 1993, accessed 21 May 2021