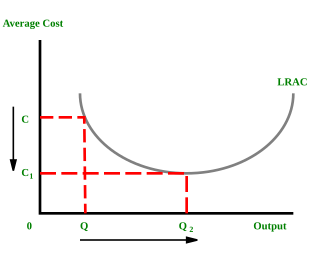
In microeconomics, economies of scale are the cost advantages that enterprises obtain due to their scale of operation, and are typically measured by the amount of output produced per unit of time. A decrease in cost per unit of output enables an increase in scale. At the basis of economies of scale, there may be technical, statistical, organizational or related factors to the degree of market control. This is just a partial description of the concept.

Microeconomics is a branch of economics that studies the behavior of individuals and firms in making decisions regarding the allocation of scarce resources and the interactions among these individuals and firms. Microeconomics focuses on the study of individual markets, sectors, or industries as opposed to the national economy as a whole, which is studied in macroeconomics.
In economics, specifically general equilibrium theory, a perfect market, also known as an atomistic market, is defined by several idealizing conditions, collectively called perfect competition, or atomistic competition. In theoretical models where conditions of perfect competition hold, it has been demonstrated that a market will reach an equilibrium in which the quantity supplied for every product or service, including labor, equals the quantity demanded at the current price. This equilibrium would be a Pareto optimum.

In microeconomics, supply and demand is an economic model of price determination in a market. It postulates that, holding all else equal, in a competitive market, the unit price for a particular good, or other traded item such as labor or current financial assets, will vary until it settles at a point where the quantity demanded will equal the quantity supplied, resulting in an economic equilibrium for price and quantity transacted. The concept of supply and demand forms the theoretical basis of modern economics.
Physical capital represents in economics one of the three primary factors of production. Physical capital is the apparatus used to produce a good and services. Physical capital represents the tangible man-made goods that help and support the production. Inventory, cash, equipment or real estate are all examples of physical capital.

In economics, profit maximization is the short run or long run process by which a firm may determine the price, input and output levels that will lead to the highest possible total profit. In neoclassical economics, which is currently the mainstream approach to microeconomics, the firm is assumed to be a "rational agent" which wants to maximize its total profit, which is the difference between its total revenue and its total cost.
The following outline is provided as an overview of and topical guide to industrial organization:
In economics, the marginal cost is the change in the total cost that arises when the quantity produced is increased, i.e. the cost of producing additional quantity. In some contexts, it refers to an increment of one unit of output, and in others it refers to the rate of change of total cost as output is increased by an infinitesimal amount. As Figure 1 shows, the marginal cost is measured in dollars per unit, whereas total cost is in dollars, and the marginal cost is the slope of the total cost, the rate at which it increases with output. Marginal cost is different from average cost, which is the total cost divided by the number of units produced.

In microeconomics, a production–possibility frontier (PPF), production possibility curve (PPC), or production possibility boundary (PPB) is a graphical representation showing all the possible options of output for two goods that can be produced using all factors of production, where the given resources are fully and efficiently utilized per unit time. A PPF illustrates several economic concepts, such as allocative efficiency, economies of scale, opportunity cost, productive efficiency, and scarcity of resources.
In economics, average cost (AC) or unit cost is equal to total cost (TC) divided by the number of units of a good produced :

In accounting and economics, fixed costs, also known as indirect costs or overhead costs, are business expenses that are not dependent on the level of goods or services produced by the business. They tend to be recurring, such as interest or rents being paid per month. These costs also tend to be capital costs. This is in contrast to variable costs, which are volume-related and unknown at the beginning of the accounting year. Fixed costs have an effect on the nature of certain variable costs.

A demand curve is a graph depicting the inverse demand function, a relationship between the price of a certain commodity and the quantity of that commodity that is demanded at that price. Demand curves can be used either for the price-quantity relationship for an individual consumer, or for all consumers in a particular market.

Variable costs are costs that change as the quantity of the good or service that a business produces changes. Variable costs are the sum of marginal costs over all units produced. They can also be considered normal costs. Fixed costs and variable costs make up the two components of total cost. Direct costs are costs that can easily be associated with a particular cost object. However, not all variable costs are direct costs. For example, variable manufacturing overhead costs are variable costs that are indirect costs, not direct costs. Variable costs are sometimes called unit-level costs as they vary with the number of units produced.
In economics, a cost curve is a graph of the costs of production as a function of total quantity produced. In a free market economy, productively efficient firms optimize their production process by minimizing cost consistent with each possible level of production, and the result is a cost curve. Profit-maximizing firms use cost curves to decide output quantities. There are various types of cost curves, all related to each other, including total and average cost curves; marginal cost curves, which are equal to the differential of the total cost curves; and variable cost curves. Some are applicable to the short run, others to the long run.

In economics, total cost (TC) is the minimum financial cost of producing some quantity of output. This is the total economic cost of production and is made up of variable cost, which varies according to the quantity of a good produced and includes inputs such as labor and raw materials, plus fixed cost, which is independent of the quantity of a good produced and includes inputs that cannot be varied in the short term such as buildings and machinery, including possibly sunk costs.
In economics, the long-run is a theoretical concept in which all markets are in equilibrium, and all prices and quantities have fully adjusted and are in equilibrium. The long-run contrasts with the short-run, in which there are some constraints and markets are not fully in equilibrium. More specifically, in microeconomics there are no fixed factors of production in the long-run, and there is enough time for adjustment so that there are no constraints preventing changing the output level by changing the capital stock or by entering or leaving an industry. This contrasts with the short-run, where some factors are variable and others are fixed, constraining entry or exit from an industry. In macroeconomics, the long-run is the period when the general price level, contractual wage rates, and expectations adjust fully to the state of the economy, in contrast to the short-run when these variables may not fully adjust.

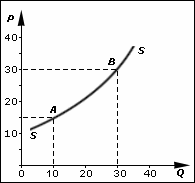
In economics, supply is the amount of a resource that firms, producers, labourers, providers of financial assets, or other economic agents are willing and able to provide to the marketplace or to an individual. Supply can be in produced goods, labour time, raw materials, or any other scarce or valuable object. Supply is often plotted graphically as a supply curve, with the price per unit on the vertical axis and quantity supplied as a function of price on the horizontal axis. This reversal of the usual position of the dependent variable and the independent variable is an unfortunate but standard convention.
A firm will choose to implement a shutdown of production when the revenue received from the sale of the goods or services produced cannot even cover the variable costs of production. In that situation, the firm will experience a higher loss when it produces, compared to not producing at all.
In economics, the marginal product of labor (MPL) is the change in output that results from employing an added unit of labor. It is a feature of the production function and depends on the amounts of physical capital and labor already in use.
The economics of science aims to understand the impact of science on the advance of technology, to explain the behavior of scientists, and to understand the efficiency or inefficiency of scientific institutions and science markets.


