In statistics, the Pearson correlation coefficient (PCC) is a correlation coefficient that measures linear correlation between two sets of data. It is the ratio between the covariance of two variables and the product of their standard deviations; thus, it is essentially a normalized measurement of the covariance, such that the result always has a value between −1 and 1. As with covariance itself, the measure can only reflect a linear correlation of variables, and ignores many other types of relationships or correlations. As a simple example, one would expect the age and height of a sample of teenagers from a high school to have a Pearson correlation coefficient significantly greater than 0, but less than 1.
In statistics, an effect size is a value measuring the strength of the relationship between two variables in a population, or a sample-based estimate of that quantity. It can refer to the value of a statistic calculated from a sample of data, the value of a parameter for a hypothetical population, or to the equation that operationalizes how statistics or parameters lead to the effect size value. Examples of effect sizes include the correlation between two variables, the regression coefficient in a regression, the mean difference, or the risk of a particular event happening. Effect sizes complement statistical hypothesis testing, and play an important role in power analyses, sample size planning, and in meta-analyses. The cluster of data-analysis methods concerning effect sizes is referred to as estimation statistics.

Cluster analysis or clustering is the task of grouping a set of objects in such a way that objects in the same group are more similar to each other than to those in other groups (clusters). It is a main task of exploratory data analysis, and a common technique for statistical data analysis, used in many fields, including pattern recognition, image analysis, information retrieval, bioinformatics, data compression, computer graphics and machine learning.
BLEU is an algorithm for evaluating the quality of text which has been machine-translated from one natural language to another. Quality is considered to be the correspondence between a machine's output and that of a human: "the closer a machine translation is to a professional human translation, the better it is" – this is the central idea behind BLEU. Invented at IBM in 2001, BLEU was one of the first metrics to claim a high correlation with human judgements of quality, and remains one of the most popular automated and inexpensive metrics.

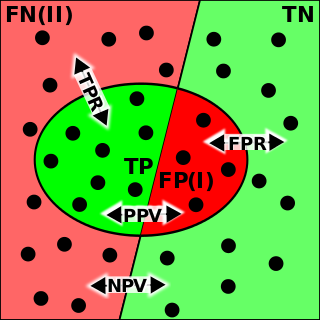
In statistical analysis of binary classification and information retrieval systems, the F-score or F-measure is a measure of predictive performance. It is calculated from the precision and recall of the test, where the precision is the number of true positive results divided by the number of all samples predicted to be positive, including those not identified correctly, and the recall is the number of true positive results divided by the number of all samples that should have been identified as positive. Precision is also known as positive predictive value, and recall is also known as sensitivity in diagnostic binary classification.
NIST is a method for evaluating the quality of text which has been translated using machine translation. Its name comes from the US National Institute of Standards and Technology.
Word error rate (WER) is a common metric of the performance of a speech recognition or machine translation system.
Various methods for the evaluation for machine translation have been employed. This article focuses on the evaluation of the output of machine translation, rather than on performance or usability evaluation.
Youden's J statistic is a single statistic that captures the performance of a dichotomous diagnostic test. (Bookmaker) Informedness is its generalization to the multiclass case and estimates the probability of an informed decision.
In pattern recognition, information retrieval, object detection and classification, precision and recall are performance metrics that apply to data retrieved from a collection, corpus or sample space.
Digital image correlation and tracking is an optical method that employs tracking and image registration techniques for accurate 2D and 3D measurements of changes in images. This method is often used to measure full-field displacement and strains, and it is widely applied in many areas of science and engineering. Compared to strain gauges and extensometers, digital image correlation methods provide finer details about deformation, due to the ability to provide both local and average data.
ROUGE, or Recall-Oriented Understudy for Gisting Evaluation, is a set of metrics and a software package used for evaluating automatic summarization and machine translation software in natural language processing. The metrics compare an automatically produced summary or translation against a reference or a set of references (human-produced) summary or translation. ROUGE metrics range between 0 and 1, with higher scores indicating higher similarity between the automatically produced summary and the reference.
In statistics, the phi coefficient is a measure of association for two binary variables.
The Fowlkes–Mallows index is an external evaluation method that is used to determine the similarity between two clusterings, and also a metric to measure confusion matrices. This measure of similarity could be either between two hierarchical clusterings or a clustering and a benchmark classification. A higher value for the Fowlkes–Mallows index indicates a greater similarity between the clusters and the benchmark classifications. It was invented by Bell Labs statisticians Edward Fowlkes and Collin Mallows in 1983.
LEPOR is an automatic language independent machine translation evaluation metric with tunable parameters and reinforced factors.
Evaluation of a binary classifier assigns a numerical value, or values, to a classifier that represent its accuracy. An example is error rate, which measures how frequently the classifier makes a mistake.
Evaluation measures for an information retrieval (IR) system assess how well an index, search engine, or database returns results from a collection of resources that satisfy a user's query. They are therefore fundamental to the success of information systems and digital platforms.
Paraphrase or paraphrasing in computational linguistics is the natural language processing task of detecting and generating paraphrases. Applications of paraphrasing are varied including information retrieval, question answering, text summarization, and plagiarism detection. Paraphrasing is also useful in the evaluation of machine translation, as well as semantic parsing and generation of new samples to expand existing corpora.
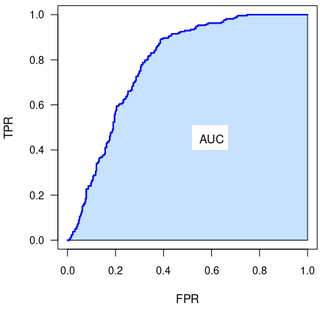
The Partial Area Under the ROC Curve (pAUC) is a metric for the performance of binary classifier.
P4 metric enables performance evaluation of the binary classifier. It is calculated from precision, recall, specificity and NPV (negative predictive value). P4 is designed in similar way to F1 metric, however addressing the criticisms leveled against F1. It may be perceived as its extension.