
File Explorer, previously known as Windows Explorer, is a file manager application and default desktop environment that is included with releases of the Microsoft Windows operating system from Windows 95 onwards. It provides a graphical user interface for accessing the file systems, as well as user interface elements such as the taskbar and desktop.
A Rich Internet Application is a web application that has many of the characteristics of desktop application software. The concept is closely related to a single-page application, and may allow the user interactive features such as drag and drop, background menu, WYSIWYG editing, etc. The concept was first introduced in 2002 by Macromedia to describe Macromedia Flash MX product. Throughout the 2000-s, the term was generalized to describe browser-based applications developed with other competing browser plugin technologies including Java applets, Microsoft Silverlight.
Windows Presentation Foundation (WPF) is a free and open-source graphical subsystem originally developed by Microsoft for rendering user interfaces in Windows-based applications. WPF, previously known as "Avalon", was initially released as part of .NET Framework 3.0 in 2006. WPF uses DirectX and attempts to provide a consistent programming model for building applications. It separates the user interface from business logic, and resembles similar XML-oriented object models, such as those implemented in XUL and SVG.
A GIS software program is a computer program to support the use of a geographic information system, providing the ability to create, store, manage, query, analyze, and visualize geographic data, that is, data representing phenomena for which location is important. The GIS software industry encompasses a broad range of commercial and open-source products that provide some or all of these capabilities within various information technology architectures.
A pivot table is a table of values which are aggregations of groups of individual values from a more extensive table within one or more discrete categories. The aggregations or summaries of the groups of the individual terms might include sums, averages, counts, or other statistics. A pivot table is the outcome of the statistical processing of tabularized raw data and can be used for decision-making.

Bing Maps is a web mapping service provided as a part of Microsoft's Bing suite of search engines and powered by the Bing Maps Platform framework which also support Bing Maps for Enterprise APIs and Azure Maps APIs. Since 2020, the map data is provided by TomTom, OpenStreetMap and others.

In business computer information systems, a dashboard is a type of graphical user interface which often provides at-a-glance views of key performance indicators (KPIs) relevant to a particular objective or business process. In other usage, "dashboard" is another name for "progress report" or "report" and considered a form of data visualization. In providing this overview, business owners can save time and improve their decision making by utilizing dashboards.

Photosynth is a discontinued app and service from Microsoft Live Labs and the University of Washington that analyzes digital photographs and generates a three-dimensional model of the photos and a point cloud of a photographed object. Pattern recognition components compare portions of images to create points, which are then compared to convert the image into a model. Users are able to view and generate their own models using a software tool available for download at the Photosynth website.

ParaView is an open-source multiple-platform application for interactive, scientific visualization. It has a client–server architecture to facilitate remote visualization of datasets, and generates level of detail (LOD) models to maintain interactive frame rates for large datasets. It is an application built on top of the Visualization Toolkit (VTK) libraries. ParaView is an application designed for data parallelism on shared-memory or distributed-memory multicomputers and clusters. It can also be run as a single-computer application.

Microsoft Popfly was a Website that allowed users to create web pages, program snippets, and mashups using the Microsoft Silverlight rich web applications runtime and the set of online tools provided. It was discontinued on August 24, 2009.
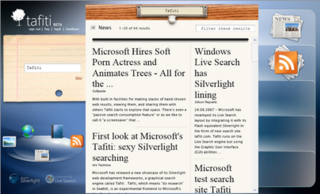
Tafiti was an animated search engine launched by Microsoft to showcase the Silverlight animation and video player.
Document cameras, also known as visual presenters, visualizers, digital overheads, or docucams, are real-time image capture devices for displaying an object to a large audience. Like an opaque projector, a document camera is able to magnify and project the images of actual, three-dimensional objects, as well as transparencies. They are, in essence, high resolution web cams, mounted on arms so as to facilitate their placement over a page. This allows a teacher, lecturer or presenter to write on a sheet of paper or to display a two or three-dimensional object while the audience watches. Theoretically, all objects can be displayed by a document camera. Most objects are simply placed under the camera. The camera takes the picture which in turn produces a live picture using a projector or monitor. Different types of document camera/visualizer allow great flexibility in terms of placement of objects. Larger objects, for example, can simply be placed in front of the camera and the camera rotated as necessary, or a ceiling mounted document camera can also be used to allow a larger working area to be used.

WorldWide Telescope (WWT) is an open-source set of applications, data and cloud services, originally created by Microsoft Research but now an open source project hosted on GitHub. The .NET Foundation holds the copyright and the project is managed by the American Astronomical Society and has been supported by grants from the Moore Foundation and National Science Foundation. WWT displays astronomical, earth and planetary data allowing visual navigation through the 3-dimensional (3D) Universe. Users are able to navigate the sky by panning and zooming, or explore the 3D universe from the surface of Earth to past the Cosmic microwave background (CMB), viewing both visual imagery and scientific data about that area and the objects in it. Data is curated from hundreds of different data sources, but its open data nature allows users to explore any third party data that conforms to a WWT supported format. With the rich source of multi-spectral all-sky images it is possible to view the sky in many wavelengths of light. The software utilizes Microsoft's Visual Experience Engine technologies to function. WWT can also be used to visualize arbitrary or abstract data sets and time series data.

Deep Zoom is a technology developed by Microsoft for efficiently transmitting and viewing images. It allows users to pan around and zoom in a large, high resolution image or a large collection of images. It reduces the time required for initial load by downloading only the region being viewed or only at the resolution it is displayed at. Subsequent regions are downloaded as the user pans to them; animations are used to hide any jerkiness in the transition. The libraries are also available in other platforms including Java and Flash.
Seadragon Software was a team within the Microsoft Live Labs. Its product, Seadragon, is a web optimized visualization technology that allows graphics and photos to be smoothly browsed, regardless of their size. Seadragon is the technology powering Microsoft's Silverlight, Pivot, Photosynth and the standalone cross-platform Seadragon application for iPhone and iPad.

Google Fusion Tables was a web service provided by Google for data management. Fusion tables was used for gathering, visualising and sharing data tables. Data are stored in multiple tables that Internet users can view and download.
Microsoft Silverlight is an application framework for writing and running rich web applications that was actively developed and marketed by Microsoft from 2007 to 2012. This is a technical overview of the platform's history.
ChronoZoom is a free open source project that visualizes time on the broadest possible scale from the Big Bang to the present day. Conceived by Walter Alvarez and Roland Saekow and developed by the department of Earth and Planetary Science at the University of California, Berkeley in collaboration with Microsoft Research and Moscow State University, Alvarez unveiled the first ChronoZoom prototype at UC Berkeley's 2010 Faculty Research Lecture. Although that demo is no longer available to the public online, a second version rewritten in HTML5 is now available and open source. ChronoZoom was inspired by the study of Big History, and it approaches the documentation and visualization of time and history in the same way that Google Earth deals with geography. ChronoZoom allows users to see the true scale of time over cosmic, geologic, biological and social periods.
Upload components are software products that are designed to be embedded into a web site to add upload functionality to it. Upload components are designed to replace the standard HTML4 upload mechanism. Compared with HTML4, Upload Components have a more user-friendly interface and support a wider range of features.
Pipeline Pilot is a desktop software program sold by Dassault Systèmes for processing and analyzing data. Originally used in the natural sciences, the product's basic ETL and analytics capabilities have broadened over time. The product is now used for data science, ETL, reporting, prediction, and analytics in a number of sectors. The main feature of the program is the ability to design data workflows using a graphical user interface. It is an example of visual and dataflow programming and has use in a variety of settings, such as cheminformatics and QSAR, Next Generation Sequencing, image analysis, and text analytics. It is not an 'object oriented' programming language.