The fifth election to Mid Glamorgan was held in May 1989. [1] It was preceded by the 1985 election and followed by the 1993 election. There were extensive boundary changes at this election.
Labour retained control with Plaid Cymru gaining some ground.
Plaid Cymru is a social-democratic political party in Wales advocating Welsh independence from the United Kingdom within the European Union.
Party | Candidate | Votes | % | ± | |
---|---|---|---|---|---|
Labour | B. Fitzgerald* | 1,369 | 85.5 | ||
Democrat | K. Gray | 233 | 14.5 | ||
Majority | 70.9 | ||||
Turnout | 39.7 | ||||
Labour win (new seat) |
Party | Candidate | Votes | % | ± | |
---|---|---|---|---|---|
Labour | R. Reed* | 841 | 54.8 | ||
Plaid Cymru | P. Richards | 635 | 41.4 | ||
Democrat | Ms M. Gee | 58 | 3.8 | ||
Majority | 13.4 | ||||
Turnout | 40.5 | ||||
Labour win (new seat) |
Party | Candidate | Votes | % | ± | |
---|---|---|---|---|---|
Labour | T. Davies* | 855 | 59.8 | ||
Plaid Cymru | D. Morgan | 574 | 40.2 | ||
Majority | 19.7 | ||||
Turnout | 28.8 | ||||
Labour win (new seat) |
Party | Candidate | Votes | % | ± | |
---|---|---|---|---|---|
Labour | V. Llywellyn* | 1,145 | 75.5 | ||
Democrat | D. Gee | 372 | 24.5 | ||
Majority | 51.0 | ||||
Turnout | 28.8 | ||||
Labour win (new seat) |
Party | Candidate | Votes | % | ± | |
---|---|---|---|---|---|
Labour | M. Prowle* | 1,143 | 55.0 | ||
Plaid Cymru | W. Daniel | 643 | 30.9 | ||
Conservative | E. Evans | 293 | 14.1 | ||
Majority | 24.1 | ||||
Turnout | 31.6 | ||||
Labour win (new seat) |
Party | Candidate | Votes | % | ± | |
---|---|---|---|---|---|
Labour | R. Phillips* | 1,065 | 49.8 | ||
Ratepayers | J. Davies | 574 | 26.8 | ||
Plaid Cymru | Ms E. Prendergast | 500 | 23.4 | ||
Majority | 23.0 | ||||
Turnout | 44.7 | ||||
Labour win (new seat) |
Party | Candidate | Votes | % | ± | |
---|---|---|---|---|---|
Labour | W. Coleman* | 1,901 | 75.3 | ||
Plaid Cymru | W. Hyde | 622 | 24.7 | ||
Majority | 50.7 | ||||
Turnout | 36.0 | ||||
Labour win (new seat) |
Party | Candidate | Votes | % | ± | |
---|---|---|---|---|---|
Labour | R. Woodyatt | 1,329 | 42.8 | ||
Independent | Angus Donaldson* | 1,068 | 34.4 | ||
Plaid Cymru | P. Bevan | 635 | 20.5 | ||
Green | J. Grayland | 70 | 2.3 | ||
Majority | 8.4 | ||||
Turnout | 43.9 | ||||
Labour win (new seat) |
Party | Candidate | Votes | % | ± | |
---|---|---|---|---|---|
Labour | M. Collis | 1,569 | 65.5 | ||
Independent | T. Evans | 825 | 34.5 | ||
Majority | 31.1 | ||||
Turnout | 40.9 | ||||
Labour win (new seat) |
Party | Candidate | Votes | % | ± | |
---|---|---|---|---|---|
Labour | L. Morgan* | unopposed | |||
Labour win (new seat) |
Party | Candidate | Votes | % | ± | |
---|---|---|---|---|---|
Social and Liberal Democrats | R. Matthews | 617 | 51.5 | ||
Conservative | Ms P. Hacking | 576 | 48.3 | ||
Majority | 3.4 | ||||
Turnout | 23.5 | ||||
Social and Liberal Democrats win (new seat) |
Party | Candidate | Votes | % | ± | |
---|---|---|---|---|---|
Labour | V. Hart* | unopposed | |||
Labour win (new seat) |
Party | Candidate | Votes | % | ± | |
---|---|---|---|---|---|
Labour | D. Morgan* | 994 | 59.7 | ||
Plaid Cymru | D. Smith | 671 | 40.3 | ||
Majority | 19.4 | ||||
Turnout | 38.3 | ||||
Labour win (new seat) |
Party | Candidate | Votes | % | ± | |
---|---|---|---|---|---|
Labour | E. Davies* | 1,947 | 88.3 | ||
Conservative | M. Powell | 258 | 11.7 | ||
Majority | 76.6 | ||||
Turnout | 44.3 | ||||
Labour win (new seat) |
Party | Candidate | Votes | % | ± | |
---|---|---|---|---|---|
Labour | M. Hughes* | unopposed | |||
Labour win (new seat) |
Party | Candidate | Votes | % | ± | |
---|---|---|---|---|---|
Labour | A. Lock* | 1,656 | 54.4 | ||
Plaid Cymru | J. Jones | 1,388 | 45.6 | ||
Majority | 8.8 | ||||
Turnout | 46.8 | ||||
Labour win (new seat) |
Party | Candidate | Votes | % | ± | |
---|---|---|---|---|---|
Labour | I. Jones | 1,050 | 61.3 | ||
Plaid Cymru | T. Jones | 662 | 38.7 | ||
Majority | 22.7 | ||||
Turnout | 45.1 | ||||
Labour win (new seat) |
Party | Candidate | Votes | % | ± | |
---|---|---|---|---|---|
Independent | Ms M. Phillips* | 1,416 | 69.4 | ||
Labour | D. Morrison | 623 | 30.6 | ||
Majority | 38.9 | ||||
Turnout | 42.6 | ||||
Independent win (new seat) |
Party | Candidate | Votes | % | ± | |
---|---|---|---|---|---|
Labour | A. Ellis* | unopposed | |||
Labour win (new seat) |
Party | Candidate | Votes | % | ± | |
---|---|---|---|---|---|
Labour | R. Edwards* | 1,866 | 76.0 | ||
Plaid Cymru | G. Howells | 588 | 24.0 | ||
Majority | 52.1 | ||||
Turnout | 41.6 | ||||
Labour win (new seat) |
Party | Candidate | Votes | % | ± | |
---|---|---|---|---|---|
Labour | T. Lewis | 1,113 | 48.5 | ||
Ratepayers | W. Healy | 1,018 | 44.3 | ||
Independent | A. Cowdell | 165 | 7.2 | ||
Majority | 95 | 4.1 | |||
Turnout | 42.2 | ||||
Labour win (new seat) |
Party | Candidate | Votes | % | ± | |
---|---|---|---|---|---|
Labour | P. Davies* | 1,923 | 52.5 | ||
Plaid Cymru | Glyn James | 1,738 | 47.5 | ||
Majority | 5.1 | ||||
Turnout | 53.3 | ||||
Labour win (new seat) |
Party | Candidate | Votes | % | ± | |
---|---|---|---|---|---|
Labour | J. Cleary* | unopposed | |||
Labour win (new seat) |
Party | Candidate | Votes | % | ± | |
---|---|---|---|---|---|
Labour | G. Thomas* | unopposed | |||
Labour win (new seat) |
Party | Candidate | Votes | % | ± | |
---|---|---|---|---|---|
Labour | R. Jenkins* | 1,302 | 58.4 | ||
Conservative | G. Down | 642 | 28.8 | ||
Plaid Cymru | Laura McAllister | 285 | 12.8 | ||
Majority | 29.6 | ||||
Turnout | 40.0 | ||||
Labour win (new seat) |
Party | Candidate | Votes | % | ± | |
---|---|---|---|---|---|
Labour | M. Ing | 1,959 | 58.1 | ||
Conservative | David Unwin | 1,410 | 41.9 | ||
Majority | 16.3 | ||||
Turnout | 43.9 | ||||
Labour win (new seat) |
Party | Candidate | Votes | % | ± | |
---|---|---|---|---|---|
Plaid Cymru | Colin Mann | 959 | 49.5 | ||
Labour | R. Dancock | 841 | 43.4 | ||
Green | G. Brown | 137 | 7.1 | ||
Majority | 6.1 | ||||
Turnout | 41.8 | ||||
Plaid Cymru win (new seat) |
Party | Candidate | Votes | % | ± | |
---|---|---|---|---|---|
Labour | G. Waters* | 1,431 | 70.6 | ||
Plaid Cymru | V. Williams | 595 | 29.4 | ||
Majority | 41.3 | ||||
Turnout | 33.9 | ||||
Labour win (new seat) |
Party | Candidate | Votes | % | ± | |
---|---|---|---|---|---|
Labour | E. Thomas* | 1,052 | 58.3 | ||
Plaid Cymru | Janet Davies | 542 | 30.0 | ||
Social and Liberal Democrats | D. Morgan | 212 | 11.7 | ||
Majority | 28.2 | ||||
Turnout | 36.5 | ||||
Labour win (new seat) |
Party | Candidate | Votes | % | ± | |
---|---|---|---|---|---|
Labour | L. Lodwig* | 922 | 55.9 | ||
Plaid Cymru | D. Watkins | 430 | 26.1 | ||
Independent | R. Bunnage | 198 | 12.0 | ||
Social and Liberal Democrats | D. Ball | 100 | 6.1 | ||
Majority | 29.8 | ||||
Turnout | 28.1 | ||||
Labour win (new seat) |
Party | Candidate | Votes | % | ± | |
---|---|---|---|---|---|
Labour | R. Davies* | 1,625 | 64.9 | ||
Independent | H. Morgan | 880 | 35.1 | ||
Majority | 29.7 | ||||
Turnout | 48.9 | ||||
Labour win (new seat) |
Party | Candidate | Votes | % | ± | |
---|---|---|---|---|---|
Labour | Jeff Jones* | unopposed | |||
Labour win (new seat) |
Party | Candidate | Votes | % | ± | |
---|---|---|---|---|---|
Labour | L. Jenkins* | 1,703 | 86.6 | ||
Conservative | S. Maddern | 263 | 13.4 | ||
Majority | 29.6 | ||||
Turnout | 40.0 | ||||
Labour win (new seat) |
Party | Candidate | Votes | % | ± | |
---|---|---|---|---|---|
Labour | T. O'Brien* | unopposed | |||
Labour win (new seat) |
Party | Candidate | Votes | % | ± | |
---|---|---|---|---|---|
Plaid Cymru | Pauline Jarman* | 1,759 | 67.7 | ||
Labour | P. Bowen | 838 | 32.2 | ||
Majority | 35.5 | ||||
Turnout | 44.2 | ||||
Plaid Cymru win (new seat) |
Party | Candidate | Votes | % | ± | |
---|---|---|---|---|---|
Labour | L. Lewis* | 1,508 | 71.4 | ||
Plaid Cymru | P. Williams | 604 | 28.6 | ||
Majority | 42.8 | ||||
Turnout | 38.4 | ||||
Labour win (new seat) |
Party | Candidate | Votes | % | ± | |
---|---|---|---|---|---|
Labour | H. Davies* | 1,678 | 54.1 | ||
Conservative | F. Bertorelli | 1,421 | 45.9 | ||
Majority | 8.3 | ||||
Turnout | 39.3 | ||||
Labour win (new seat) |
Party | Candidate | Votes | % | ± | |
---|---|---|---|---|---|
Labour | S. Gronow* | 1,287 | 61.3 | ||
Conservative | J. Padmore | 519 | 24.7 | ||
Plaid Cymru | B. Williams | 292 | 13.9 | ||
Majority | 36.6 | ||||
Turnout | 43.2 | ||||
Labour win (new seat) |
Party | Candidate | Votes | % | ± | |
---|---|---|---|---|---|
Labour | M. Chambers* | 1,463 | 50.7 | ||
Ratepayers | Eddie Thomas | 1,070 | 37.1 | ||
Plaid Cymru | G. Leyshon | 353 | 12.2 | ||
Majority | 13.6 | ||||
Turnout | 49.2 | ||||
Labour win (new seat) |
Party | Candidate | Votes | % | ± | |
---|---|---|---|---|---|
Labour | W. Philpin* | 1,957 | 72.1 | ||
Conservative | B. Rice | 756 | 27.9 | ||
Majority | 44.3 | ||||
Turnout | 39.1 | ||||
Labour win (new seat) |
Party | Candidate | Votes | % | ± | |
---|---|---|---|---|---|
Labour | D. Edwards* | 1,104 | 61.8 | ||
Plaid Cymru | S. Watts | 681 | 38.2 | ||
Majority | 23.7 | ||||
Turnout | 35.2 | ||||
Labour win (new seat) |
Party | Candidate | Votes | % | ± | |
---|---|---|---|---|---|
Labour | D. Thomas | 1,111 | 58.7 | ||
Plaid Cymru | M. Powell | 782 | 41.3 | ||
Majority | 17.4 | ||||
Turnout | 45.0 | ||||
Labour win (new seat) |
Mid Glamorgan is a preserved county of Wales. From 1974 until 1996 it was also an administrative county with a county council.
Penyrheol is a residential area of the town of Caerphilly, south Wales. It is part of the community of Penyrheol, Trecenydd and Energlyn in the County Borough of Caerphilly. It is often spelt as Pen-yr-heol by the local community. At the 2011 census the population of the community was 12,537.
Rhydyfelin is a large village and part of the community of Pontypridd, a town about two miles to its north west, in the county borough of Rhondda Cynon Taf. It is on the eastern bank of the River Taff close to the A470, and historically was in the parish of Eglwysilan.
Coedffranc is a village in the county borough of Neath Port Talbot, Wales.
Coedffranc West is an electoral ward of Neath Port Talbot county borough, Wales.
Coedffranc Central is an electoral ward of Neath Port Talbot county borough, Wales. Coedffranc Central is a part of the Coedffranc community and falls within the parliamentary constituency of Aberavon.
Halton is a unitary authority in Cheshire, England. Until 1 April 1998 it was a non-metropolitan district.
Cyfarthfa is a community and electoral ward immediately to the west of the town of Merthyr Tydfil in Merthyr Tydfil County Borough, Wales.
Park is a community and electoral ward of the county borough of Merthyr Tydfil, in Wales.
St Bride's Minor is a community in Bridgend County Borough, south Wales. Located north of Bridgend town it is made up of Sarn, a large housing estate, and the villages of Bryncethin and Abergarw. The southern border of the community is defined by the M4 motorway, though the community stretches briefly beyond the Motorway to take in the McArthurGlen Designer Outlet. The eastern, and largest area of the community consists of farmland and small scattered farm houses. At the 2001 census, the community's population was 5,575, increasing to 6,014 at the 2011 Census.
Tyn-y-nant is a district of the village of Beddau within the town and community of Llantrisant, represented by the electoral ward of the same name, within Rhondda Cynon Taf, South Wales, and includes the area of Gwaun Meisgin.
St Augustine's is an electoral ward in the town of Penarth, Vale of Glamorgan, Wales. It covers Penarth Head and Penarth Marina northeast of the town centre, including the parish church of St Augustine's. The ward elects two county councillors to Vale of Glamorgan Council and five councillors to Penarth Town Council. The ward is currently represented by the Labour Party.
Cadoc is an electoral ward in Barry, Vale of Glamorgan, Wales. It elects three county councillors to the Vale of Glamorgan Council and three town councillors to Barry Town Council.
Stanwell is an electoral ward in Penarth, Vale of Glamorgan, Wales. It elects two county councillors to the Vale of Glamorgan Council and three town councillors to Penarth Town Council.
The 1985 Mid Glamorgan County Council election were held in May 1985 and were the fourth full elections to Mid Glamorgan County Council, electing 85 councillors. They were preceded by the 1981 elections and followed by the 1989 elections.
Pembroke St Michael is the name of an electoral ward in the town of Pembroke, Pembrokeshire, Wales. It covers the east area of the town.
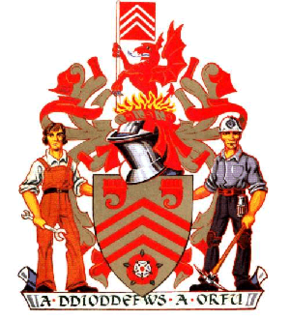
Mid Glamorgan County Council was the local authority administering the Welsh county of Mid Glamorgan between 1974 and 1996.