Multidimensional discrete convolution

Last updated

In signal processing, multidimensional discrete convolution refers to the mathematical operation between two functions f and g on an n-dimensional lattice that produces a third function, also of n-dimensions. Multidimensional discrete convolution is the discrete analog of the multidimensional convolution of functions on Euclidean space. It is also a special case of convolution on groups when the group is the group of n-tuples of integers.

Contents

Definition

Problem statement and basics

Similar to the one-dimensional case, an asterisk is used to represent the convolution operation. The number of dimensions in the given operation is reflected in the number of asterisks. For example, an M-dimensional convolution would be written with M asterisks. The following represents a M-dimensional convolution of discrete signals:

For discrete-valued signals, this convolution can be directly computed via the following:

The resulting output region of support of a discrete multidimensional convolution will be determined based on the size and regions of support of the two input signals.

Visualization of Convolution between two Simple Two-Dimensional Signals Picture1 wiki.png
Visualization of Convolution between two Simple Two-Dimensional Signals

Listed are several properties of the two-dimensional convolution operator. Note that these can also be extended for signals of -dimensions.

Commutative Property:

Associate Property:

Distributive Property:

These properties are seen in use in the figure below. Given some input that goes into a filter with impulse response and then another filter with impulse response , the output is given by . Assume that the output of the first filter is given by , this means that:

Further, that intermediate function is then convolved with the impulse response of the second filter, and thus the output can be represented by:

Using the associative property, this can be rewritten as follows:

meaning that the equivalent impulse response for a cascaded system is given by:

Both figures represent cascaded systems. Note that the order of the filters does not affect the output. Cascaded.png
Both figures represent cascaded systems. Note that the order of the filters does not affect the output.

A similar analysis can be done on a set of parallel systems illustrated below.

A system with a set of parallel filters. Parallel systems.png
A system with a set of parallel filters.

In this case, it is clear that:

Using the distributive law, it is demonstrated that:

This means that in the case of a parallel system, the equivalent impulse response is provided by:

The equivalent impulse responses in both cascaded systems and parallel systems can be generalized to systems with -number of filters. [1]

Motivation and applications

Convolution in one dimension was a powerful discovery that allowed the input and output of a linear shift-invariant (LSI) system (see LTI system theory) to be easily compared so long as the impulse response of the filter system was known. This notion carries over to multidimensional convolution as well, as simply knowing the impulse response of a multidimensional filter too allows for a direct comparison to be made between the input and output of a system. This is profound since several of the signals that are transferred in the digital world today are of multiple dimensions including images and videos. Similar to the one-dimensional convolution, the multidimensional convolution allows the computation of the output of an LSI system for a given input signal.

For example, consider an image that is sent over some wireless network subject to electro-optical noise. Possible noise sources include errors in channel transmission, the analog to digital converter, and the image sensor. Usually noise caused by the channel or sensor creates spatially-independent, high-frequency signal components that translates to arbitrary light and dark spots on the actual image. In order to rid the image data of the high-frequency spectral content, it can be multiplied by the frequency response of a low-pass filter, which based on the convolution theorem, is equivalent to convolving the signal in the time/spatial domain by the impulse response of the low-pass filter. Several impulse responses that do so are shown below. [2]

Impulse Responses of Typical Multidimensional Low Pass Filters Screen Shot 2015-11-11 at 11.18.23 PM.png
Impulse Responses of Typical Multidimensional Low Pass Filters

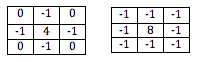
In addition to filtering out spectral content, the multidimensional convolution can implement edge detection and smoothing. This once again is wholly dependent on the values of the impulse response that is used to convolve with the input image. Typical impulse responses for edge detection are illustrated below.

Typical Impulse Responses for Edge Detection Screen Shot 2015-11-11 at 11.21.00 PM.png
Typical Impulse Responses for Edge Detection
Original image (left) and image after passing through edge-detecting filter (right) Edge detection2.png
Original image (left) and image after passing through edge-detecting filter (right)

In addition to image processing, multidimensional convolution can be implemented to enable a variety of other applications. Since filters are widespread in digital communication systems, any system that must transmit multidimensional data is assisted by filtering techniques It is used in real-time video processing, neural network analysis, digital geophysical data analysis, and much more. [3]

One typical distortion that occurs during image and video capture or transmission applications is blur that is caused by a low-pass filtering process. The introduced blur can be modeled using Gaussian low-pass filtering.

Original image (left) and blurred image (right) performed using Gaussian convolution Wiki image blur example.png
Original image (left) and blurred image (right) performed using Gaussian convolution

Row-column decomposition with separable signals

Separable signals

A signal is said to be separable if it can be written as the product of multiple one-dimensional signals. [1] Mathematically, this is expressed as the following:

Some readily recognizable separable signals include the unit step function, and the dirac-delta impulse function.

(unit step function)

(dirac-delta impulse function)

Convolution is a linear operation. It then follows that the multidimensional convolution of separable signals can be expressed as the product of many one-dimensional convolutions. For example, consider the case where x and h are both separable functions.

By applying the properties of separability, this can then be rewritten as the following:

It is readily seen then that this reduces to the product of one-dimensional convolutions:

This conclusion can then be extended to the convolution of two separable M-dimensional signals as follows:

So, when the two signals are separable, the multidimensional convolution can be computed by computing one-dimensional convolutions.

Row-column decomposition

The row-column method can be applied when one of the signals in the convolution is separable. The method exploits the properties of separability in order to achieve a method of calculating the convolution of two multidimensional signals that is more computationally efficient than direct computation of each sample (given that one of the signals are separable). [4] The following shows the mathematical reasoning behind the row-column decomposition approach (typically is the separable signal):

The value of can now be re-used when evaluating other values with a shared value of :

Thus, the resulting convolution can be effectively calculated by first performing the convolution operation on all of the rows of , and then on all of its columns. This approach can be further optimized by taking into account how memory is accessed within a computer processor.

A processor will load in the signal data needed for the given operation. For modern processors, data will be loaded from memory into the processors cache, which has faster access times than memory. The cache itself is partitioned into lines. When a cache line is loaded from memory, multiple data operands are loaded at once. Consider the optimized case where a row of signal data can fit entirely within the processor's cache. This particular processor would be able to access the data row-wise efficiently, but not column-wise since different data operands in the same column would lie on different cache lines. [5] In order to take advantage of the way in which memory is accessed, it is more efficient to transpose the data set and then access it row-wise rather than attempt to access it column-wise. The algorithm then becomes:

  1. Separate the separable two-dimensional signal into two one-dimensional signals and
  2. Perform row-wise convolution on the horizontal components of the signal using to obtain
  3. Transpose the vertical components of the signal resulting from Step 2.
  4. Perform row-wise convolution on the transposed vertical components of to get the desired output

Computational speedup from row-column decomposition

Examine the case where an image of size is being passed through a separable filter of size . The image itself is not separable. If the result is calculated using the direct convolution approach without exploiting the separability of the filter, this will require approximately multiplications and additions. If the separability of the filter is taken into account, the filtering can be performed in two steps. The first step will have multiplications and additions and the second step will have , resulting in a total of or multiplications and additions. [6] A comparison of the computational complexity between direct and separable convolution is given in the following image:

Number of computations passing a 10 x 10 Image through a filter of size J x K where J = K varies in size from 1 to 10 Picture2 wiki.png
Number of computations passing a 10 x 10 Image through a filter of size J x K where J = K varies in size from 1 to 10

Circular convolution of discrete-valued multidimensional signals

The premise behind the circular convolution approach on multidimensional signals is to develop a relation between the Convolution theorem and the Discrete Fourier transform (DFT) that can be used to calculate the convolution between two finite-extent, discrete-valued signals. [7]

Convolution theorem in multiple dimensions

For one-dimensional signals, the Convolution Theorem states that the Fourier transform of the convolution between two signals is equal to the product of the Fourier Transforms of those two signals. Thus, convolution in the time domain is equal to multiplication in the frequency domain. Mathematically, this principle is expressed via the following:

This principle is directly extendable to dealing with signals of multiple dimensions.

This property is readily extended to the usage with the Discrete Fourier transform (DFT) as follows (note that linear convolution is replaced with circular convolution where is used to denote the circular convolution operation of size ):

When dealing with signals of multiple dimensions:

The circular convolutions here will be of size .

Circular convolution approach

The motivation behind using the circular convolution approach is that it is based on the DFT. The premise behind circular convolution is to take the DFTs of the input signals, multiply them together, and then take the inverse DFT. Care must be taken such that a large enough DFT is used such that aliasing does not occur. The DFT is numerically computable when dealing with signals of finite-extent. One advantage this approach has is that since it requires taking the DFT and inverse DFT, it is possible to utilize efficient algorithms such as the Fast Fourier transform (FFT). Circular convolution can also be computed in the time/spatial domain and not only in the frequency domain.

Block diagram of circular convolution with 2 M-dimensional signals Wiki circular conv.png
Block diagram of circular convolution with 2 M-dimensional signals

Choosing DFT size to avoid aliasing

Consider the following case where two finite-extent signals x and h are taken. For both signals, there is a corresponding DFT as follows:

and

The region of support of is and and the region of support of is and .

The linear convolution of these two signals would be given as:

Given the regions of support of and , the region of support of will then be given as the following:

Based on the regions of support of the two signals, a DFT of size must be used where and since the same size DFT must be used on both signals. In the event where a DFT size larger than the extent of a signal is needed, the signal is zero-padded until it reaches the required length. After multiplying the DFTs and taking the inverse DFT on the result, the resulting circular convolution is then given by:

for

The result will be that will be a spatially aliased version of the linear convolution result . This can be expressed as the following:

Then, in order to avoid aliasing between the spatially aliased replicas, and must be chosen to satisfy the following conditions:

If these conditions are satisfied, then the results of the circular convolution will equal that of the linear convolution (taking the main period of the circular convolution as the region of support). That is:

for

Summary of procedure using DFTs

The Convolution theorem and circular convolution can thus be used in the following manner to achieve a result that is equal to performing the linear convolution: [8]

  1. Choose and to satisfy and
  2. Zero pad the signals and such that they are both in size
  3. Compute the DFTs of both and
  4. Multiple the results of the DFTs to obtain
  5. The result of the IDFT of will then be equal to the result of performing linear convolution on the two signals

Overlap and add

Another method to perform multidimensional convolution is the overlap and add approach. This method helps reduce the computational complexity often associated with multidimensional convolutions due to the vast amounts of data inherent in modern-day digital systems. [9] For sake of brevity, the two-dimensional case is used as an example, but the same concepts can be extended to multiple dimensions.

Consider a two-dimensional convolution using a direct computation:

Assuming that the output signal has N nonzero coefficients, and the impulse response has M nonzero samples, this direct computation would need MN multiplies and MN - 1 adds in order to compute. Using an FFT instead, the frequency response of the filter and the Fourier transform of the input would have to be stored in memory. [10] Massive amounts of computations and excessive use of memory storage space pose a problematic issue as more dimensions are added. This is where the overlap and add convolution method comes in.

Decomposition into smaller convolution blocks

Instead of performing convolution on the blocks of information in their entirety, the information can be broken up into smaller blocks of dimensions x resulting in smaller FFTs, less computational complexity, and less storage needed. This can be expressed mathematically as follows:

where represents the x input signal, which is a summation of block segments, with and .

To produce the output signal, a two-dimensional convolution is performed:

Substituting in for results in the following:

This convolution adds more complexity than doing a direct convolution; however, since it is integrated with an FFT fast convolution, overlap-add performs faster and is a more memory-efficient method, making it practical for large sets of multidimensional data.

Breakdown of procedure

Let be of size :

  1. Break input into non-overlapping blocks of dimensions .
  2. Zero pad such that it has dimensions () ().
  3. Use DFT to get .
  4. For each input block:
    1. Zero pad to be of dimensions () ().
    2. Take discrete Fourier transform of each block to give .
    3. Multiply to get .
    4. Take inverse discrete Fourier transform of to get .
  5. Find by overlap and adding the last samples of with the first samples of to get the result. [11]

Pictorial method of operation

In order to visualize the overlap-add method more clearly, the following illustrations examine the method graphically. Assume that the input has a square region support of length N in both vertical and horizontal directions as shown in the figure below. It is then broken up into four smaller segments in such a way that it is now composed of four smaller squares. Each block of the aggregate signal has dimensions .

Decomposed Input Signal X signal decomposed.png
Decomposed Input Signal

Then, each component is convolved with the impulse response of the filter. Note that an advantage for an implementation such as this can be visualized here since each of these convolutions can be parallelized on a computer, as long as the computer has sufficient memory and resources to store and compute simultaneously.

In the figure below, the first graph on the left represents the convolution corresponding to the component of the input with the corresponding impulse response . To the right of that, the input is then convolved with the impulse response .

Individual Component Convolution with Impulse Response Conjoined blocks.jpeg
Individual Component Convolution with Impulse Response
Convolution of each Component with the Overlap Portions Highlighted Combined convo.png
Convolution of each Component with the Overlap Portions Highlighted

The same process is done for the other two inputs respectively, and they are accumulated together in order to form the convolution. This is depicted to the left.

Assume that the filter impulse response has a region of support of in both dimensions. This entails that each convolution convolves signals with dimensions in both and directions, which leads to overlap (highlighted in blue) since the length of each individual convolution is equivalent to:

=

in both directions. The lighter blue portion correlates to the overlap between two adjacent convolutions, whereas the darker blue portion correlates to overlap between all four convolutions. All of these overlap portions are added together in addition to the convolutions in order to form the combined convolution . [12]

Overlap and save

The overlap and save method, just like the overlap and add method, is also used to reduce the computational complexity associated with discrete-time convolutions. This method, coupled with the FFT, allows for massive amounts of data to be filtered through a digital system while minimizing the necessary memory space used for computations on massive arrays of data.

Comparison to overlap and add

The overlap and save method is very similar to the overlap and add methods with a few notable exceptions. The overlap-add method involves a linear convolution of discrete-time signals, whereas the overlap-save method involves the principle of circular convolution. In addition, the overlap and save method only uses a one-time zero padding of the impulse response, while the overlap-add method involves a zero-padding for every convolution on each input component. Instead of using zero padding to prevent time-domain aliasing like its overlap-add counterpart, overlap-save simply discards all points of aliasing, and saves the previous data in one block to be copied into the convolution for the next block.

In one dimension, the performance and storage metric differences between the two methods is minimal. However, in the multidimensional convolution case, the overlap-save method is preferred over the overlap-add method in terms of speed and storage abilities. [13] Just as in the overlap and add case, the procedure invokes the two-dimensional case but can easily be extended to all multidimensional procedures.

Breakdown of procedure

Let be of size :

  1. Insert columns and rows of zeroes at the beginning of the input signal in both dimensions.
  2. Split the corresponding signal into overlapping segments of dimensions ()() in which each two-dimensional block will overlap by .
  3. Zero pad such that it has dimensions ()().
  4. Use DFT to get .
  5. For each input block:
    1. Take discrete Fourier transform of each block to give .
    2. Multiply to get .
    3. Take inverse discrete Fourier transform of to get .
    4. Get rid of the first for each output block .
  6. Find by attaching the last samples for each output block . [11]

The helix transform

Similar to row-column decomposition, the helix transform computes the multidimensional convolution by incorporating one-dimensional convolutional properties and operators. Instead of using the separability of signals, however, it maps the Cartesian coordinate space to a helical coordinate space allowing for a mapping from a multidimensional space to a one-dimensional space.

Multidimensional convolution with one-dimensional convolution methods

To understand the helix transform, it is useful to first understand how a multidimensional convolution can be broken down into a one-dimensional convolution. Assume that the two signals to be convolved are and , which results in an output . This is expressed as follows:

Next, two matrices are created that zero pad each input in both dimensions such that each input has equivalent dimensions, i.e.

and

where each of the input matrices are now of dimensions . It is then possible to implement column-wise lexicographic ordering in order to convert the modified matrices into vectors, and . In order to minimize the number of unimportant samples in each vector, each vector is truncated after the last sample in the original matrices and respectively. Given this, the length of vector and are given by:

+

+

The length of the convolution of these two vectors, , can be derived and shown to be:

This vector length is equivalent to the dimensions of the original matrix output , making converting back to a matrix a direct transformation. Thus, the vector, , is converted back to matrix form, which produces the output of the two-dimensional discrete convolution. [14]

Filtering on a helix

When working on a two-dimensional Cartesian mesh, a Fourier transform along either axes will result in the two-dimensional plane becoming a cylinder as the end of each column or row attaches to its respective top forming a cylinder. Filtering on a helix behaves in a similar fashion, except in this case, the bottom of each column attaches to the top of the next column, resulting in a helical mesh. This is illustrated below. The darkened tiles represent the filter coefficients.

Transformation from a 2D Cartesian Filtering Plane to a Helix Filter. Cartesian combined.jpeg
Transformation from a 2D Cartesian Filtering Plane to a Helix Filter.

If this helical structure is then sliced and unwound into a one-dimensional strip, the same filter coefficients on the 2-d Cartesian plane will match up with the same input data, resulting in an equivalent filtering scheme. This ensures that a two-dimensional convolution will be able to be performed by a one-dimensional convolution operator as the 2D filter has been unwound to a 1D filter with gaps of zeroes separating the filter coefficients.

One-Dimensional Filtering Strip after being Unwound. 1d strip.png
One-Dimensional Filtering Strip after being Unwound.

Assuming that some-low pass two-dimensional filter was used, such as:

0-10
-14-1
0-10

Then, once the two-dimensional space was converted into a helix, the one-dimensional filter would look as follows:

Notice in the one-dimensional filter that there are no leading zeroes as illustrated in the one-dimensional filtering strip after being unwound. The entire one-dimensional strip could have been convolved with; however, it is less computationally expensive to simply ignore the leading zeroes. In addition, none of these backside zero values will need to be stored in memory, preserving precious memory resources. [15]

Applications

Helix transformations to implement recursive filters via convolution are used in various areas of signal processing. Although frequency domain Fourier analysis is effective when systems are stationary, with constant coefficients and periodically-sampled data, it becomes more difficult in unstable systems. The helix transform enables three-dimensional post-stack migration processes that can process data for three-dimensional variations in velocity. [15] In addition, it can be applied to assist with the problem of implicit three-dimensional wavefield extrapolation. [16] Other applications include helpful algorithms in seismic data regularization, prediction error filters, and noise attenuation in geophysical digital systems. [14]

Gaussian convolution

One application of multidimensional convolution that is used within signal and image processing is Gaussian convolution. This refers to convolving an input signal with the Gaussian distribution function.

2D Gaussian Visualization where
m
1
=
m
2
=
0
{\displaystyle \mu _{1}=\mu _{2}=0}
and
s
1
=
s
2
=
1
{\displaystyle \sigma _{1}=\sigma _{2}=1} Wiki gauss.png
2D Gaussian Visualization where and

The Gaussian distribution sampled at discrete values in one dimension is given by the following (assuming ):

This is readily extended to a signal of M dimensions (assuming stays constant for all dimensions and ):

One important property to recognize is that the M dimensional signal is separable such that:

Then, Gaussian convolution with discrete-valued signals can be expressed as the following:

Approximation by FIR filter

Gaussian convolution can be effectively approximated via implementation of a Finite impulse response (FIR) filter. The filter will be designed with truncated versions of the Gaussian. For a two-dimensional filter, the transfer function of such a filter would be defined as the following: [17]

where

Choosing lower values for and will result in performing less computations, but will yield a less accurate approximation while choosing higher values will yield a more accurate approximation, but will require a greater number of computations.

Approximation by box filter

Another method for approximating Gaussian convolution is via recursive passes through a box filter. For approximating one-dimensional convolution, this filter is defined as the following: [17]

Typically, recursive passes 3, 4, or 5 times are performed in order to obtain an accurate approximation. [17] A suggested method for computing r is then given as the following: [18]

where K is the number of recursive passes through the filter.

Then, since the Gaussian distribution is separable across different dimensions, it follows that recursive passes through one-dimensional filters (isolating each dimension separately) will thus yield an approximation of the multidimensional Gaussian convolution. That is, M-dimensional Gaussian convolution could be approximated via recursive passes through the following one-dimensional filters:

Applications

Gaussian convolutions are used extensively in signal and image processing. For example, image-blurring can be accomplished with Gaussian convolution where the parameter will control the strength of the blurring. Higher values would thus correspond to a more blurry end result. [19] It is also commonly used in Computer vision applications such as Scale-invariant feature transform (SIFT) feature detection. [20]

See also

Related Research Articles

<span class="mw-page-title-main">Convolution</span> Integral expressing the amount of overlap of one function as it is shifted over another

In mathematics, convolution is a mathematical operation on two functions that produces a third function that expresses how the shape of one is modified by the other. The term convolution refers to both the result function and to the process of computing it. It is defined as the integral of the product of the two functions after one is reflected about the y-axis and shifted. The choice of which function is reflected and shifted before the integral does not change the integral result. The integral is evaluated for all values of shift, producing the convolution function.

<span class="mw-page-title-main">Discrete Fourier transform</span> Type of Fourier transform in discrete mathematics

In mathematics, the discrete Fourier transform (DFT) converts a finite sequence of equally-spaced samples of a function into a same-length sequence of equally-spaced samples of the discrete-time Fourier transform (DTFT), which is a complex-valued function of frequency. The interval at which the DTFT is sampled is the reciprocal of the duration of the input sequence. An inverse DFT (IDFT) is a Fourier series, using the DTFT samples as coefficients of complex sinusoids at the corresponding DTFT frequencies. It has the same sample-values as the original input sequence. The DFT is therefore said to be a frequency domain representation of the original input sequence. If the original sequence spans all the non-zero values of a function, its DTFT is continuous, and the DFT provides discrete samples of one cycle. If the original sequence is one cycle of a periodic function, the DFT provides all the non-zero values of one DTFT cycle.

In mathematics, the convolution theorem states that under suitable conditions the Fourier transform of a convolution of two functions is the pointwise product of their Fourier transforms. More generally, convolution in one domain equals point-wise multiplication in the other domain. Other versions of the convolution theorem are applicable to various Fourier-related transforms.

A discrete Hartley transform (DHT) is a Fourier-related transform of discrete, periodic data similar to the discrete Fourier transform (DFT), with analogous applications in signal processing and related fields. Its main distinction from the DFT is that it transforms real inputs to real outputs, with no intrinsic involvement of complex numbers. Just as the DFT is the discrete analogue of the continuous Fourier transform (FT), the DHT is the discrete analogue of the continuous Hartley transform (HT), introduced by Ralph V. L. Hartley in 1942.

In mathematics and signal processing, the Hilbert transform is a specific singular integral that takes a function, u(t) of a real variable and produces another function of a real variable H(u)(t). The Hilbert transform is given by the Cauchy principal value of the convolution with the function (see § Definition). The Hilbert transform has a particularly simple representation in the frequency domain: It imparts a phase shift of ±90° (π2 radians) to every frequency component of a function, the sign of the shift depending on the sign of the frequency (see § Relationship with the Fourier transform). The Hilbert transform is important in signal processing, where it is a component of the analytic representation of a real-valued signal u(t). The Hilbert transform was first introduced by David Hilbert in this setting, to solve a special case of the Riemann–Hilbert problem for analytic functions.

<span class="mw-page-title-main">Discrete wavelet transform</span> Transform in numerical harmonic analysis

In numerical analysis and functional analysis, a discrete wavelet transform (DWT) is any wavelet transform for which the wavelets are discretely sampled. As with other wavelet transforms, a key advantage it has over Fourier transforms is temporal resolution: it captures both frequency and location information.

In mathematics, the discrete-time Fourier transform (DTFT), also called the finite Fourier transform, is a form of Fourier analysis that is applicable to a sequence of values.

<span class="mw-page-title-main">Linear time-invariant system</span> Mathematical model which is both linear and time-invariant

In system analysis, among other fields of study, a linear time-invariant (LTI) system is a system that produces an output signal from any input signal subject to the constraints of linearity and time-invariance; these terms are briefly defined below. These properties apply (exactly or approximately) to many important physical systems, in which case the response y(t) of the system to an arbitrary input x(t) can be found directly using convolution: y(t) = (xh)(t) where h(t) is called the system's impulse response and ∗ represents convolution (not to be confused with multiplication, as is frequently employed by the symbol in computer languages). What's more, there are systematic methods for solving any such system (determining h(t)), whereas systems not meeting both properties are generally more difficult (or impossible) to solve analytically. A good example of an LTI system is any electrical circuit consisting of resistors, capacitors, inductors and linear amplifiers.

<span class="mw-page-title-main">Filter bank</span> Tool for Digital Signal Processing

In signal processing, a filter bank is an array of bandpass filters that separates the input signal into multiple components, each one carrying a single frequency sub-band of the original signal. One application of a filter bank is a graphic equalizer, which can attenuate the components differently and recombine them into a modified version of the original signal. The process of decomposition performed by the filter bank is called analysis ; the output of analysis is referred to as a subband signal with as many subbands as there are filters in the filter bank. The reconstruction process is called synthesis, meaning reconstitution of a complete signal resulting from the filtering process.

Circular convolution, also known as cyclic convolution, is a special case of periodic convolution, which is the convolution of two periodic functions that have the same period. Periodic convolution arises, for example, in the context of the discrete-time Fourier transform (DTFT). In particular, the DTFT of the product of two discrete sequences is the periodic convolution of the DTFTs of the individual sequences. And each DTFT is a periodic summation of a continuous Fourier transform function. Although DTFTs are usually continuous functions of frequency, the concepts of periodic and circular convolution are also directly applicable to discrete sequences of data. In that context, circular convolution plays an important role in maximizing the efficiency of a certain kind of common filtering operation.

In the areas of computer vision, image analysis and signal processing, the notion of scale-space representation is used for processing measurement data at multiple scales, and specifically enhance or suppress image features over different ranges of scale. A special type of scale-space representation is provided by the Gaussian scale space, where the image data in N dimensions is subjected to smoothing by Gaussian convolution. Most of the theory for Gaussian scale space deals with continuous images, whereas one when implementing this theory will have to face the fact that most measurement data are discrete. Hence, the theoretical problem arises concerning how to discretize the continuous theory while either preserving or well approximating the desirable theoretical properties that lead to the choice of the Gaussian kernel. This article describes basic approaches for this that have been developed in the literature.

<span class="mw-page-title-main">Overlap–add method</span>

In signal processing, the overlap–add method is an efficient way to evaluate the discrete convolution of a very long signal with a finite impulse response (FIR) filter :

<span class="mw-page-title-main">Overlap–save method</span>

In signal processing, overlap–save is the traditional name for an efficient way to evaluate the discrete convolution between a very long signal and a finite impulse response (FIR) filter :

Algebraic signal processing (ASP) is an emerging area of theoretical signal processing (SP). In the algebraic theory of signal processing, a set of filters is treated as an (abstract) algebra, a set of signals is treated as a module or vector space, and convolution is treated as an algebra representation. The advantage of algebraic signal processing is its generality and portability.

In mathematical analysis and applications, multidimensional transforms are used to analyze the frequency content of signals in a domain of two or more dimensions.

In signal processing, multidimensional signal processing covers all signal processing done using multidimensional signals and systems. While multidimensional signal processing is a subset of signal processing, it is unique in the sense that it deals specifically with data that can only be adequately detailed using more than one dimension. In m-D digital signal processing, useful data is sampled in more than one dimension. Examples of this are image processing and multi-sensor radar detection. Both of these examples use multiple sensors to sample signals and form images based on the manipulation of these multiple signals. Processing in multi-dimension (m-D) requires more complex algorithms, compared to the 1-D case, to handle calculations such as the fast Fourier transform due to more degrees of freedom. In some cases, m-D signals and systems can be simplified into single dimension signal processing methods, if the considered systems are separable.

Multidimensional Multirate systems find applications in image compression and coding. Several applications such as conversion between progressive video signals require usage of multidimensional multirate systems. In multidimensional multirate systems, the basic building blocks are decimation matrix (M), expansion matrix(L) and Multidimensional digital filters. The decimation and expansion matrices have dimension of D x D, where D represents the dimension. To extend the one dimensional (1-D) multirate results, there are two different ways which are based on the structure of decimation and expansion matrices. If these matrices are diagonal, separable approaches can be used, which are separable operations in each dimension. Although separable approaches might serve less complexity, non-separable methods, with non-diagonal expansion and decimation matrices, provide much better performance. The difficult part in non-separable methods is to create results in MD case by extend the 1-D case. Polyphase decomposition and maximally decimated reconstruction systems are already carried out.

In signal processing, nonlinear multidimensional signal processing (NMSP) covers all signal processing using nonlinear multidimensional signals and systems. Nonlinear multidimensional signal processing is a subset of signal processing (multidimensional signal processing). Nonlinear multi-dimensional systems can be used in a broad range such as imaging, teletraffic, communications, hydrology, geology, and economics. Nonlinear systems cannot be treated as linear systems, using Fourier transformation and wavelet analysis. Nonlinear systems will have chaotic behavior, limit cycle, steady state, bifurcation, multi-stability and so on. Nonlinear systems do not have a canonical representation, like impulse response for linear systems. But there are some efforts to characterize nonlinear systems, such as Volterra and Wiener series using polynomial integrals as the use of those methods naturally extend the signal into multi-dimensions. Another example is the Empirical mode decomposition method using Hilbert transform instead of Fourier Transform for nonlinear multi-dimensional systems. This method is an empirical method and can be directly applied to data sets. Multi-dimensional nonlinear filters (MDNF) are also an important part of NMSP, MDNF are mainly used to filter noise in real data. There are nonlinear-type hybrid filters used in color image processing, nonlinear edge-preserving filters use in magnetic resonance image restoration. Those filters use both temporal and spatial information and combine the maximum likelihood estimate with the spatial smoothing algorithm.

Multidimensional seismic data processing forms a major component of seismic profiling, a technique used in geophysical exploration. The technique itself has various applications, including mapping ocean floors, determining the structure of sediments, mapping subsurface currents and hydrocarbon exploration. Since geophysical data obtained in such techniques is a function of both space and time, multidimensional signal processing techniques may be better suited for processing such data.

Parallelmultidimensionaldigitalsignal processing (mD-DSP) is defined as the application of parallel programming and multiprocessing to digital signal processing techniques to process digital signals that have more than a single dimension. The use of mD-DSP is fundamental to many application areas such as digital image and video processing, medical imaging, geophysical signal analysis, sonar, radar, lidar, array processing, computer vision, computational photography, and augmented and virtual reality. However, as the number of dimensions of a signal increases the computational complexity to operate on the signal increases rapidly. This relationship between the number of dimensions and the amount of complexity, related to both time and space, as studied in the field of algorithm analysis, is analogues to the concept of the curse of dimensionality. This large complexity generally results in an extremely long execution run-time of a given mD-DSP application rendering its usage to become impractical for many applications; especially for real-time applications. This long run-time is the primary motivation of applying parallel algorithmic techniques to mD-DSP problems.

References

  1. 1 2 Dudgeon, Dan; Mersereau, Russell (1983), Multidimensional Digital Signal Processing, Prentice-Hall, pp. 21–22
  2. "MARBLE: Interactive Vision". homepages.inf.ed.ac.uk. Retrieved 2015-11-12.
  3. "Digital Geophysical Analysis Redesign". www-rohan.sdsu.edu. Retrieved 2015-11-12.
  4. Sihvo, Tero; Niittylahti, Jarkko (5 June 2005). "Row-Column Decomposition Based 2D Transform Optimization on Subword Parallel Processors". International Symposium on Signals, Circuits and Systems, 2005. ISSCS 2005. Vol. 1. pp. 99–102. doi:10.1109/ISSCS.2005.1509860. ISBN   978-0-7803-9029-4.
  5. "Introduction to Caches". Computer Science University of Maryland. Retrieved 10 November 2015.
  6. Eddins, Steve. "Separable Convolution". Mathwords. Retrieved 10 November 2015.
  7. Dudgeon, Dan; Mersereau, Russell (1983), Multidimensional Digital Signal Processing, Prentice-Hall, p. 70
  8. Dudgeon, Dan; Mersereau, Russell (1983), Multidimensional Digital Signal Processing, Prentice-Hall, p. 72
  9. Fernandez, Joseph; Kumar, Vijaya (2013). Multidimensional Overlap-Add and Overlap-Save for Correlation and Convolution. pp. 509–513. doi:10.1109/ICIP.2013.6738105. ISBN   978-1-4799-2341-0.
  10. "2D Signal Processing" (PDF). EE502: Digital Signal Processing. Dublin City University. p. 24. Retrieved November 11, 2015.
  11. 1 2 Kundur, Deepa. "Overlap-Save and Overlap-Add" (PDF). University of Toronto. Retrieved November 12, 2015.
  12. "2D Signal Processing" (PDF). EE502: Digital Signal Processing. Dublin City University. p. 26. Retrieved November 11, 2015.
  13. Kim, Chang; Strintzis, Michael (May 1980). "High-Speed Multidimensional Convolution". IEEE Transactions on Pattern Analysis and Machine Intelligence. PAMI-2 (3): 269–273. doi:10.1109/tpami.1980.4767017.
  14. 1 2 Naghizadeh, Mostafa; Sacchi, Mauricio (November 2009). "Multidimensional convolution via a 1D convolution algorithm". The Leading Edge.
  15. 1 2 Claerbout, Jon (September 1998). "Multidimensional recursive filters via a helix". Geophysics. 63 (5): 9. Bibcode:1998Geop...63.1532C. CiteSeerX   10.1.1.76.1193 . doi:10.1190/1.1444449.
  16. Fomel, Sergey; Claerbout, Jon (1997). "Exploring three-dimensional implicit wavefield extrapolation with the helix transform" (PDF). SEP Report: 43–60. Archived from the original (PDF) on 2019-01-04.
  17. 1 2 3 Getreuer, Pascal (2013). "A Survey of Gaussian Convolution Algorithms". Image Processing on Line. 3: 286–310. doi: 10.5201/ipol.2013.87 .
  18. Wells, W.M. (1986). "Efficient synthesis of Gaussian filters by cascaded uniform filters". IEEE Transactions on Pattern Analysis and Machine Intelligence. PAMI-8 (2): 234–239. doi:10.1109/TPAMI.1986.4767776.
  19. "Gaussian Blur - Image processing for scientists and engineers, Part 4". patrick-fuller.com. Retrieved 2015-11-12.
  20. Lowe, D.G. (1999). "Object recognition from local scale-invariant features" (PDF). Proceedings of the International Conference on Computer Vision. 2: 1150–1157.