Kernel (image processing)

Last updated

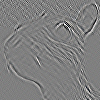
In image processing, a kernel, convolution matrix, or mask is a small matrix used for blurring, sharpening, embossing, edge detection, and more. This is accomplished by doing a convolution between the kernel and an image. Or more simply, when each pixel in the output image is a function of the nearby pixels (including itself) in the input image, the kernel is that function.

Contents

Details

The general expression of a convolution is

where is the filtered image, is the original image, is the filter kernel. Every element of the filter kernel is considered by and .

Depending on the element values, a kernel can cause a wide range of effects:

OperationKernel ωImage result g(x,y)
Identity Vd-Orig.png
Ridge or edge detection Vd-Rige1.png
Vd-Rige2.png
Sharpen Vd-Sharp.png
Box blur
(normalized)
Vd-Blur2.png
Gaussian blur 3 × 3
(approximation)
Vd-Blur1.png
Gaussian blur 5 × 5
(approximation)
Vd-Blur Gaussian 5x5.png
Unsharp masking 5 × 5
Based on Gaussian blur
with amount as 1 and
threshold as 0
(with no image mask)


Vd-Unsharp 5x5.png

The above are just a few examples of effects achievable by convolving kernels and images.

Origin

The origin is the position of the kernel which is above (conceptually) the current output pixel. This could be outside of the actual kernel, though usually it corresponds to one of the kernel elements. For a symmetric kernel, the origin is usually the center element.

Convolution

2D Convolution Animation 2D Convolution Animation.gif
2D Convolution Animation

Convolution is the process of adding each element of the image to its local neighbors, weighted by the kernel. This is related to a form of mathematical convolution. The matrix operation being performedconvolutionis not traditional matrix multiplication, despite being similarly denoted by *.

For example, if we have two three-by-three matrices, the first a kernel, and the second an image piece, convolution is the process of flipping both the rows and columns of the kernel and multiplying locally similar entries and summing. The element at coordinates [2, 2] (that is, the central element) of the resulting image would be a weighted combination of all the entries of the image matrix, with weights given by the kernel:

The other entries would be similarly weighted, where we position the center of the kernel on each of the boundary points of the image, and compute a weighted sum.

The values of a given pixel in the output image are calculated by multiplying each kernel value by the corresponding input image pixel values. This can be described algorithmically with the following pseudo-code:

for eachimage rowininput image:     for eachpixelinimage row:          setaccumulator to zero          for eachkernel rowinkernel:             for eachelementinkernel row:                  ifelement position  corresponding* to pixel positionthenmultiplyelement value  corresponding* to pixel valueaddresult to accumulatorendifsetoutput image pixel to accumulator
*corresponding input image pixels are found relative to the kernel's origin.

If the kernel is symmetric then place the center (origin) of the kernel on the current pixel. The kernel will overlap the neighboring pixels around the origin. Each kernel element should be multiplied with the pixel value it overlaps with and all of the obtained values should be summed. This resultant sum will be the new value for the current pixel currently overlapped with the center of the kernel.

If the kernel is not symmetric, it has to be flipped both around its horizontal and vertical axis before calculating the convolution as above. [1]

The general form for matrix convolution is

Edge handling

Extend Edge-Handling Extend Edge-Handling.png
Extend Edge-Handling

Kernel convolution usually requires values from pixels outside of the image boundaries. There are a variety of methods for handling image edges.

Extend
The nearest border pixels are conceptually extended as far as necessary to provide values for the convolution. Corner pixels are extended in 90° wedges. Other edge pixels are extended in lines.
Wrap
The image is conceptually wrapped (or tiled) and values are taken from the opposite edge or corner.
Mirror
The image is conceptually mirrored at the edges. For example, attempting to read a pixel 3 units outside an edge reads one 3 units inside the edge instead.
Crop / Avoid overlap
Any pixel in the output image which would require values from beyond the edge is skipped. This method can result in the output image being slightly smaller, with the edges having been cropped. Move kernel so that values from outside of image is never required. Machine learning mainly uses this approach. Example: Kernel size 10x10, image size 32x32, result image is 23x23.
Kernel Crop
Any pixel in the kernel that extends past the input image isn't used and the normalizing is adjusted to compensate.
Constant
Use constant value for pixels outside of image. Usually black or sometimes gray is used. Generally this depends on application.

Normalization

Normalization is defined as the division of each element in the kernel by the sum of all kernel elements, so that the sum of the elements of a normalized kernel is unity. This will ensure the average pixel in the modified image is as bright as the average pixel in the original image.

Optimisation

Fast convolution algorithms include:

Separable convolution

2D convolution with an M × N kernel requires M × N multiplications for each sample (pixel). If the kernel is separable, then the computation can be reduced to M + N multiplications. Using separable convolutions can significantly decrease the computation by doing 1D convolution twice instead of one 2D convolution. [2]

Implementation

Here a concrete convolution implementation done with the GLSL shading language :

// author : csblo// Work made just by consulting :// https://en.wikipedia.org/wiki/Kernel_(image_processing)// Define kernels#define identity mat3(0, 0, 0, 0, 1, 0, 0, 0, 0)#define edge0 mat3(1, 0, -1, 0, 0, 0, -1, 0, 1)#define edge1 mat3(0, 1, 0, 1, -4, 1, 0, 1, 0)#define edge2 mat3(-1, -1, -1, -1, 8, -1, -1, -1, -1)#define sharpen mat3(0, -1, 0, -1, 5, -1, 0, -1, 0)#define box_blur mat3(1, 1, 1, 1, 1, 1, 1, 1, 1) * 0.1111#define gaussian_blur mat3(1, 2, 1, 2, 4, 2, 1, 2, 1) * 0.0625#define emboss mat3(-2, -1, 0, -1, 1, 1, 0, 1, 2)// Find coordinate of matrix element from indexvec2kpos(intindex){returnvec2[9](vec2(-1,-1),vec2(0,-1),vec2(1,-1),vec2(-1,0),vec2(0,0),vec2(1,0),vec2(-1,1),vec2(0,1),vec2(1,1))[index]/iResolution.xy;}// Extract region of dimension 3x3 from sampler centered in uv// sampler : texture sampler// uv : current coordinates on sampler// return : an array of mat3, each index corresponding with a color channelmat3[3]region3x3(sampler2Dsampler,vec2uv){// Create each pixels for regionvec4[9]region;for(inti=0;i<9;i++)region[i]=texture(sampler,uv+kpos(i));// Create 3x3 region with 3 color channels (red, green, blue)mat3[3]mRegion;for(inti=0;i<3;i++)mRegion[i]=mat3(region[0][i],region[1][i],region[2][i],region[3][i],region[4][i],region[5][i],region[6][i],region[7][i],region[8][i]);returnmRegion;}// Convolve a texture with kernel// kernel : kernel used for convolution// sampler : texture sampler// uv : current coordinates on samplervec3convolution(mat3kernel,sampler2Dsampler,vec2uv){vec3fragment;// Extract a 3x3 region centered in uvmat3[3]region=region3x3(sampler,uv);// for each color channel of regionfor(inti=0;i<3;i++){// get region channelmat3rc=region[i];// component wise multiplication of kernel by region channelmat3c=matrixCompMult(kernel,rc);// add each component of matrixfloatr=c[0][0]+c[1][0]+c[2][0]+c[0][1]+c[1][1]+c[2][1]+c[0][2]+c[1][2]+c[2][2];// for fragment at channel i, set resultfragment[i]=r;}returnfragment;}voidmainImage(outvec4fragColor,invec2fragCoord){// Normalized pixel coordinates (from 0 to 1)vec2uv=fragCoord/iResolution.xy;// Convolve kernel with texturevec3col=convolution(emboss,iChannel0,uv);// Output to screenfragColor=vec4(col,1.0);}

See also

Related Research Articles

In information theory and coding theory, Reed–Solomon codes are a group of error-correcting codes that were introduced by Irving S. Reed and Gustave Solomon in 1960. They have many applications, including consumer technologies such as MiniDiscs, CDs, DVDs, Blu-ray discs, QR codes, Data Matrix, data transmission technologies such as DSL and WiMAX, broadcast systems such as satellite communications, DVB and ATSC, and storage systems such as RAID 6.

<span class="mw-page-title-main">Row and column spaces</span> Vector spaces associated to a matrix

In linear algebra, the column space of a matrix A is the span of its column vectors. The column space of a matrix is the image or range of the corresponding matrix transformation.

<span class="mw-page-title-main">Matrix multiplication</span> Mathematical operation in linear algebra

In mathematics, specifically in linear algebra, matrix multiplication is a binary operation that produces a matrix from two matrices. For matrix multiplication, the number of columns in the first matrix must be equal to the number of rows in the second matrix. The resulting matrix, known as the matrix product, has the number of rows of the first and the number of columns of the second matrix. The product of matrices A and B is denoted as AB.

In linear algebra, a Toeplitz matrix or diagonal-constant matrix, named after Otto Toeplitz, is a matrix in which each descending diagonal from left to right is constant. For instance, the following matrix is a Toeplitz matrix:

<span class="mw-page-title-main">Adjoint representation</span> Mathematical term

In mathematics, the adjoint representation of a Lie group G is a way of representing the elements of the group as linear transformations of the group's Lie algebra, considered as a vector space. For example, if G is , the Lie group of real n-by-n invertible matrices, then the adjoint representation is the group homomorphism that sends an invertible n-by-n matrix to an endomorphism of the vector space of all linear transformations of defined by: .

<span class="mw-page-title-main">Block matrix</span> Matrix defined using smaller matrices called blocks

In mathematics, a block matrix or a partitioned matrix is a matrix that is interpreted as having been broken into sections called blocks or submatrices.

<span class="mw-page-title-main">Sobel operator</span> Image edge detection algorithm

The Sobel operator, sometimes called the Sobel–Feldman operator or Sobel filter, is used in image processing and computer vision, particularly within edge detection algorithms where it creates an image emphasising edges. It is named after Irwin Sobel and Gary M. Feldman, colleagues at the Stanford Artificial Intelligence Laboratory (SAIL). Sobel and Feldman presented the idea of an "Isotropic 3 × 3 Image Gradient Operator" at a talk at SAIL in 1968. Technically, it is a discrete differentiation operator, computing an approximation of the gradient of the image intensity function. At each point in the image, the result of the Sobel–Feldman operator is either the corresponding gradient vector or the norm of this vector. The Sobel–Feldman operator is based on convolving the image with a small, separable, and integer-valued filter in the horizontal and vertical directions and is therefore relatively inexpensive in terms of computations. On the other hand, the gradient approximation that it produces is relatively crude, in particular for high-frequency variations in the image.

<span class="mw-page-title-main">Kriging</span> Method of interpolation

In statistics, originally in geostatistics, kriging or Kriging, also known as Gaussian process regression, is a method of interpolation based on Gaussian process governed by prior covariances. Under suitable assumptions of the prior, kriging gives the best linear unbiased prediction (BLUP) at unsampled locations. Interpolating methods based on other criteria such as smoothness may not yield the BLUP. The method is widely used in the domain of spatial analysis and computer experiments. The technique is also known as Wiener–Kolmogorov prediction, after Norbert Wiener and Andrey Kolmogorov.

<span class="mw-page-title-main">Cross-correlation</span> Covariance and correlation

In signal processing, cross-correlation is a measure of similarity of two series as a function of the displacement of one relative to the other. This is also known as a sliding dot product or sliding inner-product. It is commonly used for searching a long signal for a shorter, known feature. It has applications in pattern recognition, single particle analysis, electron tomography, averaging, cryptanalysis, and neurophysiology. The cross-correlation is similar in nature to the convolution of two functions. In an autocorrelation, which is the cross-correlation of a signal with itself, there will always be a peak at a lag of zero, and its size will be the signal energy.

In linear algebra, a circulant matrix is a square matrix in which all rows are composed of the same elements and each row is rotated one element to the right relative to the preceding row. It is a particular kind of Toeplitz matrix.

In mathematics, the kernel of a linear map, also known as the null space or nullspace, is the part of the domain which is mapped to the zero vector of the co-domain; the kernel is always a linear subspace of the domain. That is, given a linear map L : VW between two vector spaces V and W, the kernel of L is the vector space of all elements v of V such that L(v) = 0, where 0 denotes the zero vector in W, or more symbolically:

In mathematics, a unipotent elementr of a ring R is one such that r − 1 is a nilpotent element; in other words, (r − 1)n is zero for some n.

In mathematics, matrix calculus is a specialized notation for doing multivariable calculus, especially over spaces of matrices. It collects the various partial derivatives of a single function with respect to many variables, and/or of a multivariate function with respect to a single variable, into vectors and matrices that can be treated as single entities. This greatly simplifies operations such as finding the maximum or minimum of a multivariate function and solving systems of differential equations. The notation used here is commonly used in statistics and engineering, while the tensor index notation is preferred in physics.

<span class="mw-page-title-main">Gaussian blur</span> Type of image blur produced by a Gaussian function

In image processing, a Gaussian blur is the result of blurring an image by a Gaussian function.

<span class="mw-page-title-main">Savitzky–Golay filter</span> Algorithm to smooth data points

A Savitzky–Golay filter is a digital filter that can be applied to a set of digital data points for the purpose of smoothing the data, that is, to increase the precision of the data without distorting the signal tendency. This is achieved, in a process known as convolution, by fitting successive sub-sets of adjacent data points with a low-degree polynomial by the method of linear least squares. When the data points are equally spaced, an analytical solution to the least-squares equations can be found, in the form of a single set of "convolution coefficients" that can be applied to all data sub-sets, to give estimates of the smoothed signal, at the central point of each sub-set. The method, based on established mathematical procedures, was popularized by Abraham Savitzky and Marcel J. E. Golay, who published tables of convolution coefficients for various polynomials and sub-set sizes in 1964. Some errors in the tables have been corrected. The method has been extended for the treatment of 2- and 3-dimensional data.

In mathematics, the discrete Fourier transform over a ring generalizes the discrete Fourier transform (DFT), of a function whose values are commonly complex numbers, over an arbitrary ring.

<span class="mw-page-title-main">Polynomial regression</span> Statistics concept

In statistics, polynomial regression is a form of regression analysis in which the relationship between the independent variable x and the dependent variable y is modeled as an nth degree polynomial in x. Polynomial regression fits a nonlinear relationship between the value of x and the corresponding conditional mean of y, denoted E(y |x). Although polynomial regression fits a nonlinear model to the data, as a statistical estimation problem it is linear, in the sense that the regression function E(y | x) is linear in the unknown parameters that are estimated from the data. For this reason, polynomial regression is considered to be a special case of multiple linear regression.

In analytical mechanics, the mass matrix is a symmetric matrix M that expresses the connection between the time derivative of the generalized coordinate vector q of a system and the kinetic energy T of that system, by the equation

In mathematical systems theory, a multidimensional system or m-D system is a system in which not only one independent variable exists, but there are several independent variables.

<span class="mw-page-title-main">Generalized pencil-of-function method</span>

Generalized pencil-of-function method (GPOF), also known as matrix pencil method, is a signal processing technique for estimating a signal or extracting information with complex exponentials. Being similar to Prony and original pencil-of-function methods, it is generally preferred to those for its robustness and computational efficiency.

References

  1. "Example of 2D Convolution".
  2. "Convolution". www.songho.ca. Retrieved 2022-11-19.

Sources