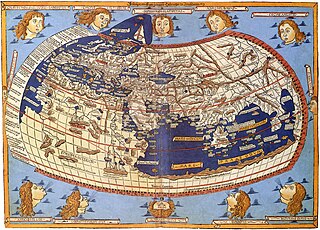
Cartography is the study and practice of making and using maps. Combining science, aesthetics and technique, cartography builds on the premise that reality can be modeled in ways that communicate spatial information effectively.
A file viewer is an application software that presents the data stored in a computer file in a human-friendly form. The file contents are generally displayed on the screen, or they may be printed. Also, they may be read aloud using speech synthesis.

The HyperText Markup Language or HTML is the standard markup language for documents designed to be displayed in a web browser. It can be assisted by technologies such as Cascading Style Sheets (CSS) and scripting languages such as JavaScript.

A map is a symbolic depiction emphasizing relationships between elements of some space, such as objects, regions, or themes.
Multimedia is a form of communication that combines different content forms such as text, audio, images, animations, or video into a single interactive presentation, in contrast to traditional mass media which features little to no interaction from users, such as printed material or audio recordings. Popular examples of multimedia include video podcasts, audio slideshows and animated videos.

Synchronized Multimedia Integration Language ) is a World Wide Web Consortium recommended Extensible Markup Language (XML) markup language to describe multimedia presentations. It defines markup for timing, layout, animations, visual transitions, and media embedding, among other things. SMIL allows presenting media items such as text, images, video, audio, links to other SMIL presentations, and files from multiple web servers. SMIL markup is written in XML, and has similarities to HTML.
vCard, also known as VCF, is a file format standard for electronic business cards. vCards can be attached to e-mail messages, sent via Multimedia Messaging Service (MMS), on the World Wide Web, instant messaging or through QR code. They can contain name and address information, phone numbers, e-mail addresses, URLs, logos, photographs, and audio clips.
Hypermedia, an extension of the term hypertext, is a nonlinear medium of information that includes graphics, audio, video, plain text and hyperlinks. This designation contrasts with the broader term multimedia, which may include non-interactive linear presentations as well as hypermedia. It is also related to the field of electronic literature. The term was first used in a 1965 article written by Ted Nelson.

Geomatics is defined in the ISO/TC 211 series of standards as the "discipline concerned with the collection, distribution, storage, analysis, processing, presentation of geographic data or geographic information". Under another definition, it consists of products, services and tools involved in the collection, integration and management of geographic (geospatial) data. It is also known as geomatic(s) engineering. Surveying engineering was the widely used name for geomatic(s) engineering in the past.
An orthophoto, orthophotograph, orthoimage or orthoimagery is an aerial photograph or satellite imagery geometrically corrected ("orthorectified") such that the scale is uniform: the photo or image follows a given map projection. Unlike an uncorrected aerial photograph, an orthophoto can be used to measure true distances, because it is an accurate representation of the Earth's surface, having been adjusted for topographic relief, lens distortion, and camera tilt.
Animated mapping is the application of animation, either a computer or video, to add a temporal component to a map displaying change in some dimension. Most commonly the change is shown over time, generally at a greatly changed scale. An example would be the animation produced after the 2004 tsunami showing how the waves spread across the Indian Ocean.
Geoinformatics is the science and the technology which develops and uses information science infrastructure to address the problems of geography, cartography, geosciences and related branches of science and engineering.
Microformats (μF) are a set of defined HTML classes created to serve as consistent and descriptive metadata about an element, designating it as representing a certain type of data. They allow software to process the information reliably by having set classes refer to a specific type of data rather than being arbitrary. Microformats emerged around 2005 and were predominantly designed for use by search engines, web syndication and aggregators such as RSS.
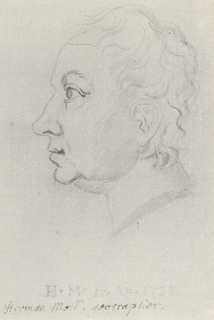
Herman Moll was a London cartographer, engraver, and publisher.
Geovisualization or geovisualisation, also known as cartographic visualization, refers to a set of tools and techniques supporting the analysis of geospatial data through the use of interactive visualization.
In cartography, rubbersheeting refers to the process by which a layer is distorted to allow it to be seamlessly joined to an adjacent geographic layer of matching imagery, such as satellite imagery which are digital maps. This is sometimes referred to as image-to-vector conflation. Often this has to be done when layers created from adjacent map sheets are joined together. Rubber-sheeting is necessary because the imagery and the vector data will rarely match up correctly due to various reasons, such as the angle at which the image was taken, the curvature of the surface of the earth, minor movements in the imaging platform, and other errors in the imagery.

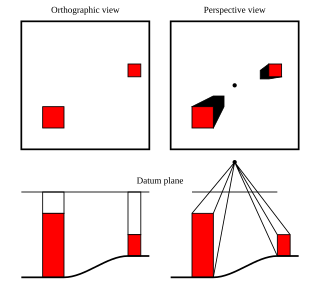
Terrain cartography or relief mapping is the depiction of the shape of the surface of the Earth on a map, using one or more of several techniques that have been developed. Terrain or relief is an essential aspect of physical geography, and as such its portrayal presents a central problem in cartographic design, and more recently geographic information systems and geovisualization.
Spatial contextual awareness consociates contextual information such as an individual's or sensor's location, activity, the time of day, and proximity to other people or objects and devices. It is also defined as the relationship between and synthesis of information garnered from the spatial environment, a cognitive agent, and a cartographic map. The spatial environment is the physical space in which the orientation or wayfinding task is to be conducted; the cognitive agent is the person or entity charged with completing a task; and the map is the representation of the environment which is used as a tool to complete the task.
A Multimedia database (MMDB) is a collection of related for multimedia data. The multimedia data include one or more primary media data types such as text, images, graphic objects animation sequences, audio and video.