Newsome Newsome and Central (1973–1982) | |
---|---|
Metropolitan Borough ward for Kirklees Council | |
County | West Yorkshire |
Population | 22,636 (2016) [1] |
Registered electors | 12,317 (2018) |
Settlements | Newsome |
Current ward | |
Created | 1973 |
First Round Councillor | Karen Allison (Green) |
Second Round Councillor | Sue Lee-Richards (Green) |
Third Round Councillor | Andrew Cooper (Green) |
Number of Councillors | Three |
Overlaps | |
UK Parliament constituency | Huddersfield |
Newsome (previously Newsome and Central, 1973 to 1982) is a Kirklees Metropolitan Borough Council Ward in the Huddersfield Parliamentary constituency.
Election | Councillor | Councillor | Councillor | |||
---|---|---|---|---|---|---|
1973 | Mennell (Lab) | J. Richardson (Lab) | D. White (Lab) | |||
1975 | G. Furness (Con) | J. Richardson (Lab) | D. White (Lab) | |||
1976 | G. Furness (Con) | B. Jenkins (Con) | D. White (Lab) | |||
1978 | G. Furness (Con) | B. Jenkins (Con) | D. White (Lab) | |||
1979 | M. Drayton (Lab) | B. Jenkins (Con) | D. White (Lab) | |||
1980 | M. Drayton (Lab) | E. Moorhouse (Lab) | D. White (Lab) | |||
1982 | E. Moorhouse (Lab) | M. Drayton (Lab) | Barrie Metcalfe (Lab) | |||
1983 | G. Colledge (SDP–Lib) | M. Drayton (Lab) | Barrie Metcalfe (Lab) | |||
1984 | G. Colledge (SDP–Lib) | M. Drayton (Lab) | Barrie Metcalfe (Lab) | |||
1986 | G. Colledge (SDP–Lib) | M. Drayton (Lab) | D. Stokes (SDP–Lib) | |||
1987 | Jamil Akhtar (Lab) | M. Drayton (Lab) | D. Stokes (SDP–Lib) | |||
1988 | Jamil Akhtar (Lab) | M. Drayton (Lab) | D. Stokes (SLD) | |||
1990 | Jamil Akhtar (Lab) | M. Drayton (Lab) | Barrie Metcalfe (Lab) | |||
1991 | Jamil Akhtar (Lab) | M. Drayton (Lab) | Barrie Metcalfe (Lab) | |||
1992 | Jamil Akhtar (Lab) | E. Lawson (Lab) | Barrie Metcalfe (Lab) | |||
1994 | Jamil Akhtar (Lab) | E. Lawson (Lab) | Barrie Metcalfe (Lab) | |||
1995 | Jamil Akhtar (Lab) | E. Lawson (Lab) | Barrie Metcalfe (Lab) | |||
1996 | Jamil Akhtar (Lab) | Nick Harvey (Green) | Barrie Metcalfe (Lab) | |||
1998 | Jamil Akhtar (Lab) | Nick Harvey (Green) | Graham Simpson (Green) | |||
1999 | Andrew Cooper (Green) | Nick Harvey (Green) | Graham Simpson (Green) | |||
2000 | Andrew Cooper (Green) | Nick Harvey (Green) | Graham Simpson (Green) | |||
2002 | Andrew Cooper (Green) | Julie Stewart (Green) | Graham Simpson (Green) | |||
2003 | Andrew Cooper (Green) | Julie Stewart (Green) | Graham Simpson (Green) | |||
2004 | Sharon Fallows (Green) | Julie Stewart-Turner [n 1] (Green) | Andrew Cooper (Green) | |||
2006 | Graham Simpson (Green) | Julie Stewart-Turner (Green) | Andrew Cooper (Green) | |||
2007 | Graham Simpson (Green) | Julie Stewart-Turner (Green) | Andrew Cooper (Green) | |||
2008 | Graham Simpson (Green) | Julie Stewart-Turner (Green) | Andrew Cooper (Green) | |||
2010 | Graham Simpson (Green) | Julie Stewart-Turner (Green) | Andrew Cooper (Green) | |||
2011 | Graham Simpson (Green) | Julie Stewart-Turner (Green) | Andrew Cooper (Green) | |||
2012 | Graham Simpson (Green) | Julie Stewart-Turner (Green) | Andrew Cooper (Green) | |||
2014 | Karen Allison (Green) | Julie Stewart-Turner (Green) | Andrew Cooper (Green) | |||
2015 | Karen Allison (Green) | Julie Stewart-Turner (Green) | Andrew Cooper (Green) | |||
2016 | Karen Allison (Green) | Julie Stewart-Turner (Green) | Andrew Cooper (Green) | |||
2018 | Karen Allison (Green) | Julie Stewart-Turner (Green) | Andrew Cooper (Green) | |||
2019 | Karen Allison (Green) | Sue Lee-Richards (Green) | Andrew Cooper (Green) | |||
2021 | Karen Allison (Green) | Sue Lee-Richards (Green) | Andrew Cooper (Green) | |||
2022 | Karen Allison (Green) | Sue Lee-Richards (Green) | Andrew Cooper (Green) | |||
2023 | Karen Allison (Green) | Sue Lee-Richards (Green) | Andrew Cooper (Green) | |||
2024 | Karen Allison (Green) | Sue Lee-Richards (Green) | Andrew Cooper (Green) | |||
indicates seat up for re-election.
indicates seat up for re-election after boundary changes.
indicates seat up for re-election after casual vacancy.
Party | Candidate | Votes | % | ±% | |
---|---|---|---|---|---|
Green | Andrew Cooper | 2,593 | 66.8 | +2.5 | |
Labour | Mark Morris | 892 | 23.0 | -1.5 | |
Conservative | Kath Bellamy | 272 | 7.0 | -0.6 | |
Liberal Democrats | Waheed Anwar | 125 | 3.2 | +1.3 | |
Green hold | Swing | ||||
Party | Candidate | Votes | % | ±% | |
---|---|---|---|---|---|
Green | Sue Lee-Richards | 2,197 | 64.3 | +1.5 | |
Labour | Jane Rylah | 837 | 24.5 | -3.4 | |
Conservative | Charles Ayugbo | 258 | 7.6 | +0.8 | |
Liberal Democrats | Patrycja Bartosinka | 64 | 1.9 | -0.5 | |
Yorkshire | Bikatshi Katenga | 61 | 1.8 | +0.1 | |
Green hold | Swing | ||||
Party | Candidate | Votes | % | ±% | |
---|---|---|---|---|---|
Green | Karen Allison | 2,360 | 60.6 | -0.4 | |
Labour | Mohammed Safdar | 984 | 25.3 | -0.6 | |
Conservative | John Roberts | 379 | 9.7 | -1.8 | |
Liberal Democrats | Andrew Wilkinson | 106 | 2.7 | +1.1 | |
Yorkshire | Bikatshi Katenga | 68 | 1.7 | N/A | |
Green hold | Swing | ||||
Party | Candidate | Votes | % | ±% | |
---|---|---|---|---|---|
Green | Andrew Cooper | 2,592 | 60.97 | -2.0 | |
Labour | Pauline Wheat-Bowen | 1,102 | 25.92 | -2.0 | |
Conservative | Maria Ackroyd | 499 | 11.48 | +5.5 | |
Liberal Democrats | Andrew Wilkinson | 69 | 1.62 | -1 | |
Green hold | Swing | ||||
Party | Candidate | Votes | % | ±% | |
---|---|---|---|---|---|
Green | Sue Lee-Richards | 2,455 | 62.8 | ||
Labour | Chris Owen | 1,092 | 27.9 | ||
Conservative | Scarlett Black | 266 | 6.8 | ||
Liberal Democrats | Andrew Wilkinson | 95 | 2.4 | ||
Green hold | Swing | ||||
Party | Candidate | Votes | % | ±% | |
---|---|---|---|---|---|
Green | Karen Allison | 2,215 | 51.5 | 0.4 | |
Labour | Jo Lawson | 1,593 | 37.0 | 2.0 | |
Conservative | Charlie Reid | 366 | 8.5 | 1.8 | |
Liberal Democrats | Andrew Wilkinson | 75 | 1.7 | 0.7 | |
Yorkshire | Bikatshi Katenga | 56 | 1.3 | New | |
Majority | 622 | 14.5 | 1.6 | ||
Registered electors | 12,317 | ||||
Turnout | 4,313 | 35.0 | 3.6 | ||
Rejected ballots | 8 | 0.2 | 0.6 | ||
Green hold | Swing | 0.8 | |||
Party | Candidate | Votes | % | ±% | |
---|---|---|---|---|---|
Green | Andrew Cooper | 2,428 | 51.9 | 14.2 | |
Labour | Nadeem Iqbal | 1,822 | 39.0 | 5.3 | |
Conservative | Pauline McGleenan | 312 | 6.7 | 6.1 | |
Liberal Democrats | Stephen Bird | 113 | 2.4 | 0.4 | |
Majority | 606 | 12.9 | 8.9 | ||
Registered electors | 12,193 | ||||
Turnout | 4,711 | 38.6 | |||
Rejected ballots | 36 | 0.8 | |||
Green hold | Swing | 4.5 | |||
Party | Candidate | Votes | % | ±% | |
---|---|---|---|---|---|
Green | Julie Stewart-Turner | 2,842 | 37.7 | 6.2 | |
Labour | Nadeem Iqbal | 2,537 | 33.7 | 4.3 | |
Conservative | Tasmin Coloney | 965 | 12.8 | 4.7 | |
UKIP | Ian French | 889 | 11.8 | 3.0 | |
Liberal Democrats | Eleanor Ritchie | 213 | 2.8 | 0.1 | |
TUSC | Paul Randall | 85 | 1.1 | ||
Majority | 305 | 4.0 | 10.5 | ||
Registered electors | 12,801 | ||||
Green hold | Swing | 5.3 | |||
Party | Candidate | Votes | % | ±% | |
---|---|---|---|---|---|
Green | Karen Allison | 1,793 | 43.9 | 9.1 | |
Labour | Sheikh Ullah | 1,201 | 29.4 | 5.5 | |
UKIP | Ian French | 603 | 14.8 | New | |
Conservative | Simon Ackroyd | 332 | 8.1 | 0.4 | |
Liberal Democrats | Eleanor Ritchie | 111 | 2.7 | 1.0 | |
TUSC | Jake Lawley | 47 | 1.1 | 1.6 | |
Majority | 592 | 14.5 | 3.6 | ||
Green hold | Swing | 1.8 | |||
Party | Candidate | Votes | % | ±% | |
---|---|---|---|---|---|
Green | Andrew Cooper | 2,354 | 53.0 | 1.4 | |
Labour | Sadia Rehman | 1,552 | 34.9 | 5.7 | |
Conservative | Mark Dodsworth | 344 | 7.7 | 3.6 | |
TUSC | Ian Slattery | 119 | 2.7 | 0.5 | |
Liberal Democrats | Rilwan Olateju | 76 | 1.7 | 3.0 | |
Majority | 802 | 18.1 | 4.3 | ||
Registered electors | 14,199 | ||||
Turnout | 31.3 | 3.3 | |||
Green hold | Swing | 2.2 | |||
Party | Candidate | Votes | % | ±% | |
---|---|---|---|---|---|
Green | Julie Stewart-Turner | 2,450 | 51.6 | 18.8 | |
Labour | Mohammed Saeed | 1,383 | 29.2 | 4.1 | |
Conservative | Jas Virdee | 536 | 11.3 | 4.5 | |
Liberal Democrats | Philip Scott | 255 | 4.7 | 14.3 | |
TUSC | Ian Slattery | 150 | 3.2 | New | |
Majority | 1,067 | 22.4 | 14.7 | ||
Registered electors | 13,955 | ||||
Turnout | 34.6 | 18.7 | |||
Green hold | Swing | 7.4 | |||
Party | Candidate | Votes | % | ±% | |
---|---|---|---|---|---|
Green | Graham Simpson | 2,447 | 32.8 | 14.1 | |
Labour | Munir Ahmed | 1,878 | 25.1 | 3.0 | |
Liberal Democrats | Philip Scott | 1,421 | 19.0 | 12.8 | |
Conservative | Bernard McGuin | 1,178 | 15.8 | 0.2 | |
BNP | Stuart Exley | 435 | 5.8 | 3.5 | |
Independent | Hazel Spencer | 109 | 1.5 | New | |
Majority | 569 | 7.7 | 17.1 | ||
Registered electors | 14,010 | ||||
Turnout | 53.3 | 20.7 | |||
Green hold | Swing | 8.6 | |||
Party | Candidate | Votes | % | ±% | |
---|---|---|---|---|---|
Green | Andrew Cooper | 1,942 | 46.9 | 5.8 | |
Labour | Jean Goodison | 916 | 22.1 | 4.1 | |
Conservative | Janice Thomas | 645 | 15.6 | 1.9 | |
BNP | Stuart Exley | 384 | 9.3 | New | |
Liberal Democrats | Helen Greaves | 256 | 6.2 | 1.3 | |
Majority | 1,026 | 24.8 | 1.7 | ||
Registered electors | 12,866 | ||||
Turnout | 32.6 | 1.7 | |||
Green hold | Swing | 0.9 | |||
Party | Candidate | Votes | % | ±% | |
---|---|---|---|---|---|
Green | Julie Stewart-Turner | 2,083 | 52.7 | 10.8 | |
Labour | Jamil Akhtar | 1,035 | 26.2 | 0.1 | |
Conservative | Neil Drake | 541 | 13.7 | 3.0 | |
Liberal Democrats | David Wainwright | 296 | 7.5 | 2.2 | |
Majority | 1,048 | 26.5 | 10.9 | ||
Registered electors | 12,904 | ||||
Turnout | 30.9 | 3.5 | |||
Green hold | Swing | 5.5 | |||
Party | Candidate | Votes | % | ±% | |
---|---|---|---|---|---|
Green | Graham Simpson | 1,817 | 41.9 | 5.0 | |
Labour | Mohammad Iqbal | 1,140 | 26.3 | 6.8 | |
BNP | Simon Towers | 491 | 11.3 | 1.7 | |
Conservative | Neil Drake | 464 | 10.7 | 0.6 | |
Liberal Democrats | Kuldip Brar | 420 | 9.7 | 6.3 | |
Majority | 677 | 15.6 | 1.8 | ||
Registered electors | 12,224 | ||||
Turnout | 34.4 | 9.1 | |||
Green hold | Swing | 0.9 | |||
Party | Candidate | Votes | % | ±% | |
---|---|---|---|---|---|
Green | Andrew Cooper [n 2] | 2,006 | 36.9 | N/A | |
Green | Julie Stewart-Turner [n 3] | 1,965 | – | – | |
Green | Sharon Fallows [n 4] | 1,882 | – | – | |
Labour | Jamil Akhtar | 1,062 | 19.5 | N/A | |
Labour | Garth Pratt | 950 | – | – | |
Liberal Democrats | Kuldip Brar | 868 | 16.0 | N/A | |
Labour | Elsie Wheatley | 829 | – | – | |
Liberal Democrats | Anne Thornton | 772 | – | – | |
BNP | Allan Milton | 709 | 13.0 | N/A | |
Liberal Democrats | David Crossley | 673 | – | – | |
Conservative | Neil Drake | 548 | 10.1 | N/A | |
Conservative | Stephen Halstead | 460 | – | – | |
Conservative | Anne Henderson | 420 | – | – | |
Socialist Alternative | Jean Goodison | 245 | 4.5 | N/A | |
Socialist Alternative | Dylan Murphy | 101 | – | – | |
Socialist Alternative | Michael Forster | 100 | – | – | |
Majority | 944 | 17.4 | N/A | ||
Registered electors | 11,815 | ||||
Turnout | 43.5 | N/A | |||
Green win (new seat) | |||||
Green win (new seat) |
Party | Candidate | Votes | % | ±% | |
---|---|---|---|---|---|
Green | Andrew Cooper | 1,984 | 61.1 | 6.7 | |
Labour | Garth Pratt | 651 | 20.0 | 3.4 | |
Liberal Democrats | Anne Thornton | 290 | 8.9 | 2.0 | |
Socialist Alternative | Jean Goodison | 165 | 5.1 | 2.2 | |
Conservative | Anah Mahenn | 159 | 4.9 | 3.5 | |
Majority | 1,333 | 41.1 | 10.1 | ||
Registered electors | 10,199 | ||||
Turnout | 31.9 | 1.4 | |||
Green hold | Swing | 5.1 | |||
Party | Candidate | Votes | % | ±% | |
---|---|---|---|---|---|
Green | Graham Simpson [n 2] | 2,000 | 54.4 | 4.6 | |
Green | Julie Stewart [n 4] | 1,812 | – | – | |
Labour | Garth Pratt | 861 | 23.4 | 1.9 | |
Labour | Gilbert Hanson | 744 | – | – | |
Liberal Democrats | Andrew Hirst | 401 | 10.9 | 1.4 | |
Liberal Democrats | Anne Thornton | 351 | – | – | |
Conservative | Michael Brooke | 310 | 8.4 | 3.1 | |
Conservative | Paul Ambler | 197 | – | – | |
Socialist Alternative | Dylan Murphy | 107 | 2.9 | New | |
Majority | 1,139 | 31.0 | 6.5 | ||
Registered electors | 10,708 | ||||
Turnout | 33.3 | 3.1 | |||
Green hold | Swing | 3.3 | |||
Green hold | Swing | – | |||
Party | Candidate | Votes | % | ±% | |
---|---|---|---|---|---|
Green | Nicholas Harvey | 2,400 | 59.0 | 7.3 | |
Labour | Barrie Metcalfe | 875 | 21.5 | 16.8 | |
Liberal Democrats | Rana Younas | 500 | 12.3 | 8.1 | |
Conservative | Oliver Colling | 216 | 5.3 | 0.5 | |
Kirklees Council Watch | Sean Hellawell | 77 | 1.9 | New | |
Majority | 1,525 | 37.5 | 24.1 | ||
Registered electors | 11,290 | ||||
Turnout | 36.4 | 3.8 | |||
Green hold | Swing | 12.1 | |||
Party | Candidate | Votes | % | ±% | |
---|---|---|---|---|---|
Green | Andrew Cooper | 2,360 | 52.2 | 4.6 | |
Labour | Jamil Akhtar | 1,749 | 38.7 | 5.0 | |
Conservative | Oliver Colling | 264 | 5.0 | 1.2 | |
Liberal Democrats | D. Waddington | 190 | 4.2 | 0.9 | |
Majority | 611 | 13.5 | 9.6 | ||
Registered electors | 11,255 | ||||
Turnout | 40.2 | 2.3 | |||
Green gain from Labour | Swing | 4.8 | |||
Party | Candidate | Votes | % | ±% | |
---|---|---|---|---|---|
Green | Graham Simpson | 2,424 | 56.8 | 7.9 | |
Labour | Barrie Metcalfe | 1,440 | 33.7 | 3.8 | |
Conservative | K. Giles | 264 | 6.2 | New | |
Liberal Democrats | D. Waddington | 141 | 3.3 | 2.1 | |
Majority | 984 | 23.1 | 11.7 | ||
Registered electors | 11,356 | ||||
Turnout | 37.9 | 7.8 | |||
Green gain from Labour | Swing | 5.9 | |||
Party | Candidate | Votes | % | ±% | |
---|---|---|---|---|---|
Green | Nicholas Harvey | 3,300 | 64.7 | 24.2 | |
Labour | E. Lawson | 1,525 | 29.9 | 14.4 | |
Liberal Democrats | P. Akhtar | 278 | 5.4 | 1.9 | |
Majority | 1,775 | 34.8 | N/A | ||
Registered electors | 11,269 | ||||
Turnout | 45.7 | 1.9 | |||
Green gain from Labour | Swing | 19.3 | |||
Party | Candidate | Votes | % | ±% | |
---|---|---|---|---|---|
Labour | Jamil Akhtar | 2,176 | 44.3 | 6.3 | |
Green | Nicholas Harvey | 1,993 | 40.5 | 21.4 | |
Conservative | A. Brice | 389 | 7.9 | 6.7 | |
Liberal Democrats | B. Burgess | 359 | 7.3 | 8.4 | |
Majority | 183 | 3.8 | 27.7 | ||
Registered electors | 11,233 | ||||
Turnout | 43.8 | 0.7 | |||
Labour hold | Swing | 13.9 | |||
Party | Candidate | Votes | % | ±% | |
---|---|---|---|---|---|
Labour | Barrie Metcalfe | 2,549 | 50.6 | 1.3 | |
Green | Nicholas Harvey | 961 | 19.1 | 13.1 | |
Liberal Democrats | P. Oyston | 789 | 15.7 | New | |
Conservative | J. Broadbent | 735 | 14.6 | 27.5 | |
Majority | 1,588 | 31.5 | 21.7 | ||
Registered electors | 11,312 | ||||
Turnout | 44.5 | 9.5 | |||
Labour hold | Swing | 10.9 | |||
Party | Candidate | Votes | % | ±% | |
---|---|---|---|---|---|
Labour | E. Lawson | 2,077 | 51.9 | 3.0 | |
Conservative | R. Kaye | 1,687 | 42.1 | 13.4 | |
Green | I. McCourtie | 240 | 6.0 | 0.3 | |
Majority | 390 | 9.8 | 10.4 | ||
Registered electors | 11,480 | ||||
Turnout | 35.0 | 8.3 | |||
Labour hold | Swing | 5.2 | |||
Party | Candidate | Votes | % | ±% | |
---|---|---|---|---|---|
Labour | Jamil Akhtar | 2,433 | 48.9 | 8.0 | |
Conservative | B. Sutcliffe | 1,429 | 28.7 | 11.0 | |
Liberal Democrats | M. Homfray | 800 | 16.1 | 1.8 | |
Green | H. Bewsher | 314 | 6.3 | 1.2 | |
Majority | 1,004 | 20.2 | 18.8 | ||
Registered electors | 11,487 | ||||
Turnout | 43.3 | 6.9 | |||
Labour hold | Swing | 9.4 | |||
Party | Candidate | Votes | % | ±% | |
---|---|---|---|---|---|
Labour | Barrie Metcalfe | 3,143 | 56.9 | 2.3 | |
SLD | D. Stokes | 991 | 17.9 | New | |
Conservative | V. Tucker | 976 | 17.7 | 12.9 | |
Green | K. Harvey | 412 | 7.5 | 7.3 | |
Majority | 2,152 | 39.0 | 15.0 | ||
Registered electors | 11,011 | ||||
Turnout | 50.2 | 7.5 | |||
Labour gain from SLD | Swing | 7.5 | |||
Party | Candidate | Votes | % | ±% | |
---|---|---|---|---|---|
Labour | M. Drayton | 2,643 | 54.6 | 15.7 | |
Conservative | B. Sutcliffe | 1,479 | 30.6 | 0.1 | |
Green | Nicholas Harvey | 715 | 14.8 | 9.3 | |
Majority | 1,164 | 24.0 | 15.6 | ||
Registered electors | 11,338 | ||||
Turnout | 42.7 | 7.8 | |||
Labour hold | Swing | 7.8 | |||
Party | Candidate | Votes | % | ±% | |
---|---|---|---|---|---|
Labour | Jamil Akhtar | 2,212 | 38.9 | 8.6 | |
Conservative | B. Sutcliffe | 1,737 | 30.5 | New | |
Alliance | M. Chatrik | 1,427 | 25.1 | 27.4 | |
Green | Nicholas Harvey | 310 | 5.5 | New | |
Majority | 475 | 8.4 | N/A | ||
Registered electors | 11,264 | ||||
Turnout | 50.5 | 3.3 | |||
Labour gain from Alliance | Swing | 6.7 | |||
Party | Candidate | Votes | % | ±% | |
---|---|---|---|---|---|
Alliance | D. Stokes | 2,789 | 52.5 | 16.0 | |
Labour | Barrie Metcalfe | 2,527 | 47.5 | 1.0 | |
Majority | 262 | 5.0 | N/A | ||
Registered electors | 11,263 | ||||
Turnout | 47.2 | 3.2 | |||
Alliance gain from Labour | Swing | 7.5 | |||
Party | Candidate | Votes | % | ±% | |
---|---|---|---|---|---|
Labour | M. Drayton | 2,316 | 46.5 | 8.3 | |
Alliance | P. Baker | 1,818 | 36.5 | 2.2 | |
Conservative | A. Haigh | 852 | 17.1 | 6.0 | |
Majority | 498 | 10.0 | N/A | ||
Registered electors | 11,332 | ||||
Turnout | 44.0 | 0.1 | |||
Labour hold | Swing | 5.3 | |||
Party | Candidate | Votes | % | ±% | |
---|---|---|---|---|---|
Alliance | G. Colledge | 1,916 | 38.6 | 9.3 | |
Labour | Jamil Akhtar | 1,889 | 38.1 | 7.1 | |
Conservative | F. Midgley | 1,144 | 23.3 | 2.2 | |
Majority | 27 | 0.5 | N/A | ||
Registered electors | 11,298 | ||||
Turnout | 43.9 | 3.0 | |||
Alliance gain from Labour | Swing | 8.2 | |||
Party | Candidate | Votes | % | ±% | |
---|---|---|---|---|---|
Labour | Barrie Metcalfe [n 2] | 2,011 | 45.2 | N/A | |
Labour | M. Drayton [n 3] | 1,976 | – | – | |
Labour | E. Moorhouse [n 4] | 1,885 | – | – | |
Alliance | D. Marshall | 1,302 | 29.3 | N/A | |
Alliance | G. Colledge | 1,271 | – | – | |
Conservative | M. Calkin | 1,133 | 25.5 | N/A | |
Conservative | H. Lynes | 1,090 | – | – | |
Alliance | A. Armstrong | 947 | – | – | |
Majority | 709 | 15.9 | N/A | ||
Registered electors | 10,870 | ||||
Turnout | 40.9 | N/A | |||
Labour win (new seat) | |||||
Labour win (new seat) |
Party | Candidate | Votes | % | ±% | |
---|---|---|---|---|---|
Labour | E. Moorhouse | 2,208 | 56.1 | 7.7 | |
Conservative | B. Jenkins | 1,059 | 26.9 | 3.6 | |
Liberal | B. Burgess | 671 | 17.0 | 4.2 | |
Majority | 1,149 | 29.2 | 11.3 | ||
Registered electors | 11,251 | ||||
Turnout | 35.0 | 36.8 | |||
Labour gain from Conservative | Swing | 5.7 | |||
Party | Candidate | Votes | % | ±% | |
---|---|---|---|---|---|
Labour | M. Drayton | 3,833 | 48.4 | 3.1 | |
Conservative | G. Furness | 2,415 | 30.5 | 13.8 | |
Liberal | B. Burgess | 1,679 | 21.2 | 10.8 | |
Majority | 1,418 | 17.9 | 16.9 | ||
Registered electors | 11,045 | ||||
Turnout | 71.8 | 35.1 | |||
Labour gain from Conservative | Swing | 8.5 | |||
Party | Candidate | Votes | % | ±% | |
---|---|---|---|---|---|
Labour | D. White | 1,834 | 45.3 | 7.9 | |
Conservative | R. Heywood | 1,794 | 44.3 | 4.2 | |
Liberal | D. Adams | 420 | 10.4 | 12.1 | |
Majority | 40 | 1.0 | N/A | ||
Registered electors | 11,030 | ||||
Turnout | 36.7 | 4.4 | |||
Labour hold | Swing | 1.9 | |||
Party | Candidate | Votes | % | ±% | |
---|---|---|---|---|---|
Conservative | B. Jenkins | 1,791 | 40.1 | 0.6 | |
Labour | J. Richardson | 1,668 | 37.4 | 5.0 | |
Liberal | J. Crossley | 1,003 | 22.5 | 4.5 | |
Majority | 123 | 2.7 | 5.6 | ||
Registered electors | 10,894 | ||||
Turnout | 41.1 | 5.0 | |||
Conservative gain from Labour | Swing | 2.8 | |||
Party | Candidate | Votes | % | ±% | |
---|---|---|---|---|---|
Conservative | G. Furness | 1,642 | 40.7 | 14.6 | |
Labour | Mennell | 1,308 | 32.4 | 13.4 | |
Liberal | Hasler | 1,089 | 27.0 | 1.1 | |
Majority | 334 | 8.3 | N/A | ||
Registered electors | 11,175 | ||||
Turnout | 36.1 | 1.0 | |||
Conservative gain from Labour | Swing | 5.2 | |||
Party | Candidate | Votes | % | ±% | |
---|---|---|---|---|---|
Labour | D. White [n 2] | 1,903 | 45.8 | N/A | |
Labour | J. Richardson [n 3] | 1,881 | – | – | |
Labour | Mennell [n 4] | 1,760 | – | – | |
Liberal | Hasler | 1,169 | 28.1 | N/A | |
Conservative | B. Jenkins | 1,083 | 26.1 | N/A | |
Liberal | Scott | 1,040 | – | – | |
Conservative | Littlewood | 1,007 | – | – | |
Conservative | Parfitt | 939 | – | – | |
Liberal | Edinburgh | 883 | – | – | |
Majority | 734 | 17.7 | N/A | ||
Registered electors | 11,191 | ||||
Turnout | 37.1 | N/A | |||
Labour win (new seat) | |||||
Labour win (new seat) |
• italics denote the sitting councillor • bold denotes the winning candidate
Kirklees is a metropolitan borough of West Yorkshire, England. The borough comprises the ten towns of Batley, Birstall, Cleckheaton, Dewsbury, Heckmondwike, Holmfirth, Huddersfield, Meltham, Mirfield and Slaithwaite. It is governed by Kirklees Council. Kirklees had a population of 422,500 in 2011; it is the third-largest metropolitan district in England by area, behind Doncaster and Leeds.
Kirklees Council is the local authority for the metropolitan borough of Kirklees in West Yorkshire, England. Since the last boundary changes in 2004, the council has comprised 69 councillors representing 23 wards. Elections are held three years out of four, with one third of the councillors elected each time for a four-year term.
Trafford Metropolitan Borough Council elections are generally held three years out of every four, with a third of the council being elected each time. Trafford Metropolitan Borough Council, generally known as Trafford Council, is the local authority for the metropolitan borough of Trafford in Greater Manchester, England. Since the last boundary changes in 2023, 63 councillors have been elected from 21 wards.
Kirklees Council, also known as Kirklees Metropolitan Borough Council, is the local authority for the metropolitan borough of Kirklees in West Yorkshire, England. As a metropolitan borough council it provides the majority of local government services in the borough. Since 2014 the council has been a constituent members of the West Yorkshire Combined Authority.
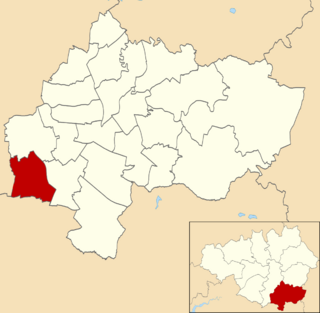
Heald Green is an electoral ward in the Metropolitan Borough of Stockport. It elects three Councillors to Stockport Metropolitan Borough Council using the first past the post electoral method, electing each Councillor for a three-year term with no election every fourth year.
St. Michaels ward is an electoral district of Liverpool City Council centred on the St Michael's district of Liverpool and within the Liverpool Riverside Parliamentary constituency.
The first elections to Bolton Metropolitan Borough Council were held on Thursday, 10 May 1973, with the entirety of the 69 seat council - three seats for each of the 23 wards - up for vote. It was the first council election as the newly formed metropolitan borough under a new constitution. The Local Government Act 1972 stipulated that the elected members were to shadow and eventually take over from the County Borough of Bolton, the Municipal Borough of Farnworth, the Urban Districts of Blackrod, Horwich, Kearsley, Little Lever, and Westhoughton, and the southern part of Turton Urban District on 1 April 1974. The order in which the councillors were elected dictated their term serving, with third-place candidates serving two years and up for re-election in 1975, second-placed three years expiring in 1976 and 1st-placed five years until 1978.
The first elections to the newly created Calderdale Metropolitan Borough Council were held on 10 May 1973, with the entirety of the 51 seat council — three seats for each of the 17 wards — up for vote. The Local Government Act 1972 stipulated that the elected members were to shadow and eventually take over from the predecessor corporation on 1 April 1974. The order in which the councillors were elected dictated their term serving, with third-place candidates serving two years and up for re-election in 1975, second-placed three years expiring in 1976 and 1st-placed five years until 1978.
Birkenhead and Tranmere is a Wirral Metropolitan Borough Council ward in the Birkenhead Parliamentary constituency.
Prenton is a Wirral Metropolitan Borough Council Ward in the Birkenhead Parliamentary constituency. Through the first decade of the twenty-first century, the ward was in Liberal Democrat hands, before shifting firmly to Labour in the second. But the 2019 council elections saw a swing to the Green Party that has been presented as characteristic of the Green gains in English council elections that year.
Oxton is a Wirral Metropolitan Borough Council ward in the Birkenhead Parliamentary constituency.
The 1976 Wirral Metropolitan Borough Council election took place on 6 May 1976 to elect Wirral Metropolitan Borough Council members in England. This election was held on the same day as other local elections.
The 1978 Wirral Metropolitan Borough Council election took place on 4 May 1978 to elect members of Wirral Metropolitan Borough Council in England. This election was held on the same day as other local elections.
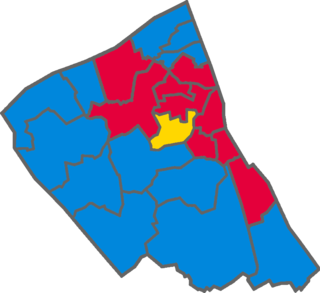
The 1979 Wirral Metropolitan Borough Council election took place on 3 May 1979 to elect members of Wirral Metropolitan Borough Council in England. This election was held on the same day as other local elections.
The 1980 Wirral Metropolitan Borough Council election took place on 1 May 1980 to elect members of Wirral Metropolitan Borough Council in England. This election was held on the same day as other local elections.
The 1986 Wirral Metropolitan Borough Council election took place on 8 May 1986 to elect members of Wirral Metropolitan Borough Council in England. This election was held on the same day as other local elections.
The 1990 Wirral Metropolitan Borough Council election took place on 3 May 1990 to elect members of Wirral Metropolitan Borough Council in England. This election was held on the same day as other local elections.
The 1994 Wirral Metropolitan Borough Council election took place on 5 May 1994 to elect members of Wirral Metropolitan Borough Council in England. This election was held on the same day as other local elections.
The 2022 Kirklees Metropolitan Borough Council election took place on 5 May 2022. One third of councillors—23 out of 69—on Kirklees Metropolitan Borough Council were elected. The election took place alongside other local elections across the United Kingdom.
The 2023 Kirklees Metropolitan Borough Council elections were held on 4 May 2023 alongside other elections across the United Kingdom. 24 out of the 69 seats on Kirklees Metropolitan Borough Council were contested.