Related Research Articles

In statistics and probability theory, the median is the value separating the higher half from the lower half of a data sample, a population, or a probability distribution. For a data set, it may be thought of as "the middle" value. The basic feature of the median in describing data compared to the mean is that it is not skewed by a small proportion of extremely large or small values, and therefore provides a better representation of a "typical" value. Median income, for example, may be a better way to suggest what a "typical" income is, because income distribution can be very skewed. The median is of central importance in robust statistics, as it is the most resistant statistic, having a breakdown point of 50%: so long as no more than half the data are contaminated, the median is not an arbitrarily large or small result.
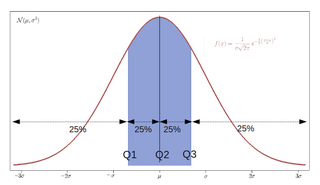
In statistics and probability, quantiles are cut points dividing the range of a probability distribution into continuous intervals with equal probabilities, or dividing the observations in a sample in the same way. There is one fewer quantile than the number of groups created. Common quantiles have special names, such as quartiles, deciles, and percentiles. The groups created are termed halves, thirds, quarters, etc., though sometimes the terms for the quantile are used for the groups created, rather than for the cut points.

In statistics, the standard deviation is a measure of the amount of variation or dispersion of a set of values. A low standard deviation indicates that the values tend to be close to the mean of the set, while a high standard deviation indicates that the values are spread out over a wider range.

In statistics, an outlier is a data point that differs significantly from other observations. An outlier may be due to variability in the measurement or it may indicate experimental error; the latter are sometimes excluded from the data set. An outlier can cause serious problems in statistical analyses.
In descriptive statistics, a box plot or boxplot is a method for graphically depicting groups of numerical data through their quartiles. Box plots may also have lines extending from the boxes (whiskers) indicating variability outside the upper and lower quartiles, hence the terms box-and-whisker plot and box-and-whisker diagram. Outliers may be plotted as individual points. Box plots are non-parametric: they display variation in samples of a statistical population without making any assumptions of the underlying statistical distribution. The spacings between the different parts of the box indicate the degree of dispersion (spread) and skewness in the data, and show outliers. In addition to the points themselves, they allow one to visually estimate various L-estimators, notably the interquartile range, midhinge, range, mid-range, and trimean. Box plots can be drawn either horizontally or vertically. Box plots received their name from the box in the middle, and from the plot that they are.
Parametric statistics is a branch of statistics which assumes that sample data comes from a population that can be adequately modeled by a probability distribution that has a fixed set of parameters. Conversely a non-parametric model does not assume an explicit (finite-parametric) mathematical form for the distribution when modeling the data. However, it may make some assumptions about that distribution, such as continuity or symmetry.
In statistics, a confidence interval (CI) is a type of estimate computed from the statistics of the observed data. This gives a range of values for an unknown parameter. The interval has an associated confidence level that gives the probability with which an estimated interval will contain the true value of the parameter. The confidence level is chosen by the investigator. For a given estimation in a given sample, using a higher confidence level generates a wider confidence interval. In general terms, a confidence interval for an unknown parameter is based on sampling the distribution of a corresponding estimator.

A Z-test is any statistical test for which the distribution of the test statistic under the null hypothesis can be approximated by a normal distribution. Z-tests test the mean of a distribution. For each significance level in the confidence interval, the Z-test has a single critical value which makes it more convenient than the Student's t-test whose critical values are defined by the sample size.
In statistics and optimization, errors and residuals are two closely related and easily confused measures of the deviation of an observed value of an element of a statistical sample from its "theoretical value". The error of an observed value is the deviation of the observed value from the (unobservable) true value of a quantity of interest, and the residual of an observed value is the difference between the observed value and the estimated value of the quantity of interest. The distinction is most important in regression analysis, where the concepts are sometimes called the regression errors and regression residuals and where they lead to the concept of studentized residuals.

In statistics, rankits of a set of data are the expected values of the order statistics of a sample from the standard normal distribution the same size as the data. They are primarily used in the normal probability plot, a graphical technique for normality testing.

The normal probability plot is a graphical technique to identify substantive departures from normality. This includes identifying outliers, skewness, kurtosis, a need for transformations, and mixtures. Normal probability plots are made of raw data, residuals from model fits, and estimated parameters.
In probability theory and statistics, the coefficient of variation (CV), also known as relative standard deviation (RSD), is a standardized measure of dispersion of a probability distribution or frequency distribution. It is often expressed as a percentage, and is defined as the ratio of the standard deviation to the mean . The CV or RSD is widely used in analytical chemistry to express the precision and repeatability of an assay. It is also commonly used in fields such as engineering or physics when doing quality assurance studies and ANOVA gauge R&R. In addition, CV is utilized by economists and investors in economic models.

In statistical significance testing, a one-tailed test and a two-tailed test are alternative ways of computing the statistical significance of a parameter inferred from a data set, in terms of a test statistic. A two-tailed test is appropriate if the estimated value is greater or less than a certain range of values, for example, whether a test taker may score above or below a specific range of scores. This method is used for null hypothesis testing and if the estimated value exists in the critical areas, the alternative hypothesis is accepted over the null hypothesis. A one-tailed test is appropriate if the estimated value may depart from the reference value in only one direction, left or right, but not both. An example can be whether a machine produces more than one-percent defective products. In this situation, if the estimated value exists in one of the one-sided critical areas, depending on the direction of interest, the alternative hypothesis is accepted over the null hypothesis. Alternative names are one-sided and two-sided tests; the terminology "tail" is used because the extreme portions of distributions, where observations lead to rejection of the null hypothesis, are small and often "tail off" toward zero as in the normal distribution, colored in yellow, or "bell curve", pictured on the right and colored in green.
The mode is the value that appears most often in a set of data values. If X is a discrete random variable, the mode is the value x at which the probability mass function takes its maximum value. In other words, it is the value that is most likely to be sampled.
The following is a glossary of terms used in the mathematical sciences statistics and probability.
Robust statistics are statistics with good performance for data drawn from a wide range of probability distributions, especially for distributions that are not normal. Robust statistical methods have been developed for many common problems, such as estimating location, scale, and regression parameters. One motivation is to produce statistical methods that are not unduly affected by outliers. Another motivation is to provide methods with good performance when there are small departures from parametric distribution. For example, robust methods work well for mixtures of two normal distributions with different standard-deviations; under this model, non-robust methods like a t-test work poorly.

In statistics, a Q–Q (quantile-quantile) plot is a probability plot, which is a graphical method for comparing two probability distributions by plotting their quantiles against each other. First, the set of intervals for the quantiles is chosen. A point (x, y) on the plot corresponds to one of the quantiles of the second distribution plotted against the same quantile of the first distribution. Thus the line is a parametric curve with the parameter which is the number of the interval for the quantile.
Bootstrapping is any test or metric that uses random sampling with replacement, and falls under the broader class of resampling methods. Bootstrapping assigns measures of accuracy to sample estimates. This technique allows estimation of the sampling distribution of almost any statistic using random sampling methods.
In probability theory and statistics, the index of dispersion, dispersion index,coefficient of dispersion,relative variance, or variance-to-mean ratio (VMR), like the coefficient of variation, is a normalized measure of the dispersion of a probability distribution: it is a measure used to quantify whether a set of observed occurrences are clustered or dispersed compared to a standard statistical model.

A plot is a graphical technique for representing a data set, usually as a graph showing the relationship between two or more variables. The plot can be drawn by hand or by a computer. In the past, sometimes mechanical or electronic plotters were used. Graphs are a visual representation of the relationship between variables, which are very useful for humans who can then quickly derive an understanding which may not have come from lists of values. Given a scale or ruler, graphs can also be used to read off the value of an unknown variable plotted as a function of a known one, but this can also be done with data presented in tabular form. Graphs of functions are used in mathematics, sciences, engineering, technology, finance, and other areas.
References
- ↑ Everitt, B.S. (2002) The Cambridge Dictionary of Statistics (2nd Edition). Cambridge University Press. ISBN 0-521-81099-X