Psychological statistics is application of formulas, theorems, numbers and laws to psychology. Statistical methods for psychology include development and application statistical theory and methods for modeling psychological data. These methods include psychometrics, factor analysis, experimental designs, and Bayesian statistics. The article also discusses journals in the same field.

Principal component analysis (PCA) is a popular technique for analyzing large datasets containing a high number of dimensions/features per observation, increasing the interpretability of data while preserving the maximum amount of information, and enabling the visualization of multidimensional data. Formally, PCA is a statistical technique for reducing the dimensionality of a dataset. This is accomplished by linearly transforming the data into a new coordinate system where the variation in the data can be described with fewer dimensions than the initial data. Many studies use the first two principal components in order to plot the data in two dimensions and to visually identify clusters of closely related data points. Principal component analysis has applications in many fields such as population genetics, microbiome studies, and atmospheric science.
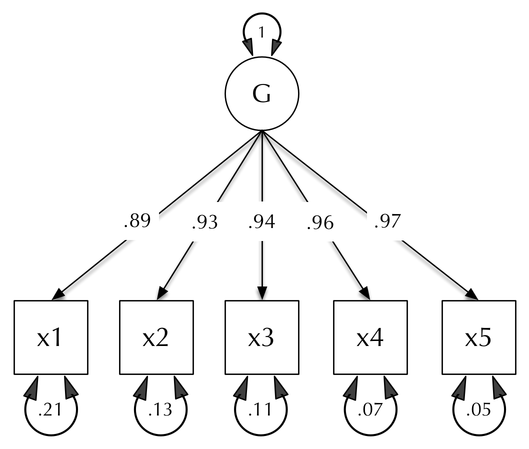
Factor analysis is a statistical method used to describe variability among observed, correlated variables in terms of a potentially lower number of unobserved variables called factors. For example, it is possible that variations in six observed variables mainly reflect the variations in two unobserved (underlying) variables. Factor analysis searches for such joint variations in response to unobserved latent variables. The observed variables are modelled as linear combinations of the potential factors plus "error" terms, hence factor analysis can be thought of as a special case of errors-in-variables models.

In statistics, canonical-correlation analysis (CCA), also called canonical variates analysis, is a way of inferring information from cross-covariance matrices. If we have two vectors X = (X1, ..., Xn) and Y = (Y1, ..., Ym) of random variables, and there are correlations among the variables, then canonical-correlation analysis will find linear combinations of X and Y which have maximum correlation with each other. T. R. Knapp notes that "virtually all of the commonly encountered parametric tests of significance can be treated as special cases of canonical-correlation analysis, which is the general procedure for investigating the relationships between two sets of variables." The method was first introduced by Harold Hotelling in 1936, although in the context of angles between flats the mathematical concept was published by Jordan in 1875.
In statistics, sometimes the covariance matrix of a multivariate random variable is not known but has to be estimated. Estimation of covariance matrices then deals with the question of how to approximate the actual covariance matrix on the basis of a sample from the multivariate distribution. Simple cases, where observations are complete, can be dealt with by using the sample covariance matrix. The sample covariance matrix (SCM) is an unbiased and efficient estimator of the covariance matrix if the space of covariance matrices is viewed as an extrinsic convex cone in Rp×p; however, measured using the intrinsic geometry of positive-definite matrices, the SCM is a biased and inefficient estimator. In addition, if the random variable has a normal distribution, the sample covariance matrix has a Wishart distribution and a slightly differently scaled version of it is the maximum likelihood estimate. Cases involving missing data, heteroscedasticity, or autocorrelated residuals require deeper considerations. Another issue is the robustness to outliers, to which sample covariance matrices are highly sensitive.
Partial least squares regression is a statistical method that bears some relation to principal components regression; instead of finding hyperplanes of maximum variance between the response and independent variables, it finds a linear regression model by projecting the predicted variables and the observable variables to a new space. Because both the X and Y data are projected to new spaces, the PLS family of methods are known as bilinear factor models. Partial least squares discriminant analysis (PLS-DA) is a variant used when the Y is categorical.
In statistics, econometrics, epidemiology and related disciplines, the method of instrumental variables (IV) is used to estimate causal relationships when controlled experiments are not feasible or when a treatment is not successfully delivered to every unit in a randomized experiment. Intuitively, IVs are used when an explanatory variable of interest is correlated with the error term, in which case ordinary least squares and ANOVA give biased results. A valid instrument induces changes in the explanatory variable but has no independent effect on the dependent variable, allowing a researcher to uncover the causal effect of the explanatory variable on the dependent variable.
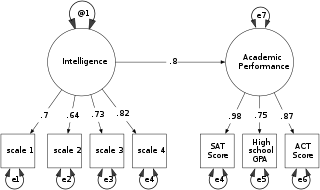
Structural equation modeling (SEM) is a label for a diverse set of methods used by scientists doing both observational and experimental research. SEM is used mostly in the social and behavioral sciences but it is also used in epidemiology, business, and other fields. A definition of SEM is difficult without reference to technical language, but a good starting place is the name itself.
Vector autoregression (VAR) is a statistical model used to capture the relationship between multiple quantities as they change over time. VAR is a type of stochastic process model. VAR models generalize the single-variable (univariate) autoregressive model by allowing for multivariate time series. VAR models are often used in economics and the natural sciences.
Latent growth modeling is a statistical technique used in the structural equation modeling (SEM) framework to estimate growth trajectories. It is a longitudinal analysis technique to estimate growth over a period of time. It is widely used in the field of psychology, behavioral science, education and social science. It is also called latent growth curve analysis. The latent growth model was derived from theories of SEM. General purpose SEM software, such as OpenMx, lavaan, AMOS, Mplus, LISREL, or EQS among others may be used to estimate growth trajectories.
In statistics, confirmatory factor analysis (CFA) is a special form of factor analysis, most commonly used in social science research. It is used to test whether measures of a construct are consistent with a researcher's understanding of the nature of that construct. As such, the objective of confirmatory factor analysis is to test whether the data fit a hypothesized measurement model. This hypothesized model is based on theory and/or previous analytic research. CFA was first developed by Jöreskog (1969) and has built upon and replaced older methods of analyzing construct validity such as the MTMM Matrix as described in Campbell & Fiske (1959).
The multitrait-multimethod (MTMM) matrix is an approach to examining construct validity developed by Campbell and Fiske (1959). It organizes convergent and discriminant validity evidence for comparison of how a measure relates to other measures. The conceptual approach has influenced experimental design and measurement theory in psychology, including applications in structural equation models.
LISREL is a proprietary statistical software package used in structural equation modeling (SEM) for manifest and latent variables. It requires a "fairly high level of statistical sophistication".
Karl Gustav Jöreskog is a Swedish statistician. Jöreskog is a professor emeritus at Uppsala University, and a co-author of the LISREL statistical program. He is also a member of the Royal Swedish Academy of Sciences. Jöreskog received his bachelor's, master's, and doctoral degrees at Uppsala University. He is also a former student of Herman Wold. He was a statistician at Educational Testing Service (ETS) and a visiting professor at Princeton University.
Psychometric software is software that is used for psychometric analysis of data from tests, questionnaires, or inventories reflecting latent psychoeducational variables. While some psychometric analyses can be performed with standard statistical software like SPSS, most analyses require specialized tools.
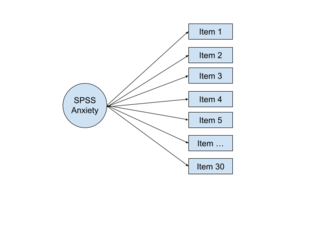
In multivariate statistics, exploratory factor analysis (EFA) is a statistical method used to uncover the underlying structure of a relatively large set of variables. EFA is a technique within factor analysis whose overarching goal is to identify the underlying relationships between measured variables. It is commonly used by researchers when developing a scale and serves to identify a set of latent constructs underlying a battery of measured variables. It should be used when the researcher has no a priori hypothesis about factors or patterns of measured variables. Measured variables are any one of several attributes of people that may be observed and measured. Examples of measured variables could be the physical height, weight, and pulse rate of a human being. Usually, researchers would have a large number of measured variables, which are assumed to be related to a smaller number of "unobserved" factors. Researchers must carefully consider the number of measured variables to include in the analysis. EFA procedures are more accurate when each factor is represented by multiple measured variables in the analysis.
Kernel methods are a well-established tool to analyze the relationship between input data and the corresponding output of a function. Kernels encapsulate the properties of functions in a computationally efficient way and allow algorithms to easily swap functions of varying complexity.
The partial least squares path modeling or partial least squares structural equation modeling is a method for structural equation modeling that allows estimation of complex cause-effect relationships in path models with latent variables.
In statistical models applied to psychometrics, congeneric reliability a single-administration test score reliability coefficient, commonly referred to as composite reliability, construct reliability, and coefficient omega. is a structural equation model (SEM)-based reliability coefficients and is obtained from on a unidimensional model. is the second most commonly used reliability factor after tau-equivalent reliability(), and is often recommended as its alternative.
In statistics, confirmatory composite analysis (CCA) is a sub-type of structural equation modeling (SEM). Although, historically, CCA emerged from a re-orientation and re-start of partial least squares path modeling (PLS-PM), it has become an independent approach and the two should not be confused. In many ways it is similar to, but also quite distinct from confirmatory factor analysis (CFA). It shares with CFA the process of model specification, model identification, model estimation, and model assessment. However, in contrast to CFA which always assumes the existence of latent variables, in CCA all variables can be observable, with their interrelationships expressed in terms of composites, i.e., linear compounds of subsets of the variables. The composites are treated as the fundamental objects and path diagrams can be used to illustrate their relationships. This makes CCA particularly useful for disciplines examining theoretical concepts that are designed to attain certain goals, so-called artifacts, and their interplay with theoretical concepts of behavioral sciences.