Climate is the long-term weather pattern in a region, typically averaged over 30 years. More rigorously, it is the mean and variability of meteorological variables over a time spanning from months to millions of years. Some of the meteorological variables that are commonly measured are temperature, humidity, atmospheric pressure, wind, and precipitation. In a broader sense, climate is the state of the components of the climate system, including the atmosphere, hydrosphere, cryosphere, lithosphere and biosphere and the interactions between them. The climate of a location is affected by its latitude, longitude, terrain, altitude, land use and nearby water bodies and their currents.

Hydrology is the scientific study of the movement, distribution, and management of water on Earth and other planets, including the water cycle, water resources, and drainage basin sustainability. A practitioner of hydrology is called a hydrologist. Hydrologists are scientists studying earth or environmental science, civil or environmental engineering, and physical geography. Using various analytical methods and scientific techniques, they collect and analyze data to help solve water related problems such as environmental preservation, natural disasters, and water management.

A drought is a period of drier-than-normal conditions. A drought can last for days, months or years. Drought often has large impacts on the ecosystems and agriculture of affected regions, and causes harm to the local economy. Annual dry seasons in the tropics significantly increase the chances of a drought developing, with subsequent increased wildfire risks. Heat waves can significantly worsen drought conditions by increasing evapotranspiration. This dries out forests and other vegetation, and increases the amount of fuel for wildfires.

Evapotranspiration (ET) refers to the combined processes which move water from the Earth's surface into the atmosphere. It covers both water evaporation and transpiration. Evapotranspiration is an important part of the local water cycle and climate, and measurement of it plays a key role in agricultural irrigation and water resource management.

Potential evapotranspiration (PET) or potential evaporation (PE) is the amount of water that would be evaporated and transpired by a specific crop, soil or ecosystem if there was sufficient water available. It is a reflection of the energy available to evaporate or transpire water, and of the wind available to transport the water vapor from the ground up into the lower atmosphere and away from the initial location. Potential evapotranspiration is expressed in terms of a depth of water or soil moisture percentage.

Environmental degradation is the deterioration of the environment through depletion of resources such as quality of air, water and soil; the destruction of ecosystems; habitat destruction; the extinction of wildlife; and pollution. It is defined as any change or disturbance to the environment perceived to be deleterious or undesirable. The environmental degradation process amplifies the impact of environmental issues which leave lasting impacts on the environment.

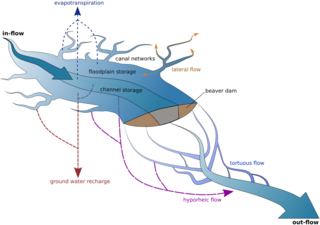
Ecohydrology is an interdisciplinary scientific field studying the interactions between water and ecological systems. It is considered a sub discipline of hydrology, with an ecological focus. These interactions may take place within water bodies, such as rivers and lakes, or on land, in forests, deserts, and other terrestrial ecosystems. Areas of research in ecohydrology include transpiration and plant water use, adaption of organisms to their water environment, influence of vegetation and benthic plants on stream flow and function, and feedbacks between ecological processes, the soil carbon sponge and the hydrological cycle.
An aridity index (AI) is a numerical indicator of the degree of dryness of the climate at a given location. The American Meteorological Society defined it in meteorology and climatology, as "the degree to which a climate lacks effective, life-promoting moisture". Aridity is different from drought because aridity is permanent whereas drought is temporary. A number of aridity indices have been proposed ; these indicators serve to identify, locate or delimit regions that suffer from a deficit of available water, a condition that can severely affect the effective use of the land for such activities as agriculture or stock-farming.
Downscaling is any procedure to infer high-resolution information from low-resolution variables. This technique is based on dynamical or statistical approaches commonly used in several disciplines, especially meteorology, climatology and remote sensing. The term downscaling usually refers to an increase in spatial resolution, but it is often also used for temporal resolution. This is not to be confused with image downscaling which is a process of reducing an image from a higher resolution to a lower resolution.

Climate classifications are systems that categorize the world's climates. A climate classification may correlate closely with a biome classification, as climate is a major influence on life in a region. One of the most used is the Köppen climate classification scheme first developed in 1884.
The Keetch–Byram drought index, created by John Keetch and George Byram in 1968 for the United States Department of Agriculture's Forest Service, is a measure of drought conditions. It is commonly used for the purpose of predicting the likelihood and severity of wildfire. It is calculated based on rainfall, air temperature, and other meteorological factors.

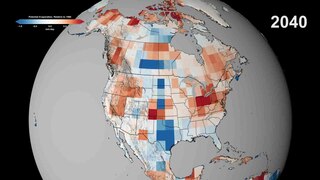
The United States' contiguous western and especially southwestern region has experienced widespread drought since about year 2000. Below normal precipitation leads to drought, and is caused by an above average persistence of high pressure over the affected area. Changes in the track of extratropical cyclones, which can occur during climate cycles such as the El Niño-Southern Oscillation, or ENSO, as well as the North Atlantic Oscillation, Pacific Decadal Oscillation, and Atlantic multidecadal oscillation, modulate which areas are more prone to drought. Increased drought frequency and severity is also expected to be one of the effects of global warming.

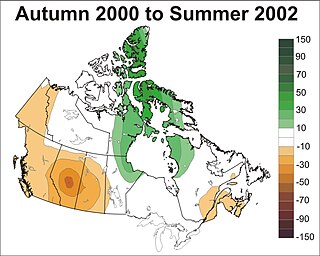
Prolonged, large-area droughts are among Canada's costliest natural disasters having major impacts on a wide range of sectors including agriculture, forestry, industry, municipalities, recreation, human health, society and ecosystems. They frequently stress water availability by depleting soil moisture, reducing stream flows, lowering lake and reservoir levels, and diminishing groundwater supplies. This ultimately affects several economic activities including for example, decreased agricultural production, less hydro-electric power generation, and increased freshwater transportation costs. Droughts also create major environmental hazards such as reduced water quality, wetland loss, soil erosion and degradation, and ecological habitat destruction.

The European Climate Assessment and Dataset (ECA&D) is a database of daily meteorological station observations across Europe and is gradually being extended to countries in the Middle East and North Africa. ECA&D has attained the status of Regional Climate Centre for high-resolution observation data in World Meteorological Organization Region VI.
A water year is a term commonly used in hydrology to describe a time period of 12 months for which precipitation totals are measured. Its beginning differs from the calendar year because part of the precipitation that falls in late autumn and winter accumulates as snow and does not drain until the following spring or summer's snowmelt. The goal is to ensure that as much as possible of the surface runoff during the water year is attributable to the precipitation during the same water year.
PERSIANN, "Precipitation Estimation from Remotely Sensed Information using Artificial Neural Networks", is a satellite-based precipitation retrieval algorithm that provides near real-time rainfall information. The algorithm uses infrared (IR) satellite data from global geosynchronous satellites as the primary source of precipitation information. Precipitation from IR images is based on statistical relationship between cloud top temperature and precipitation rates. The IR-based precipitation estimates are then calibrated using satellite microwave data available from low Earth orbit satellites. The calibration technique relies on an adaptive training algorithm that updates the retrieval parameters when microwave observations become available.

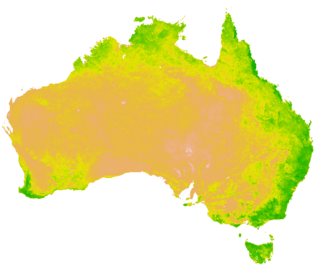
A vegetation index (VI) is a spectral imaging transformation of two or more image bands designed to enhance the contribution of vegetation properties and allow reliable spatial and temporal inter-comparisons of terrestrial photosynthetic activity and canopy structural variations.

The effects of climate change on the water cycle are profound and have been described as an intensification or a strengthening of the water cycle. This effect has been observed since at least 1980. One example is when heavy rain events become even stronger. The effects of climate change on the water cycle have important negative effects on the availability of freshwater resources, as well as other water reservoirs such as oceans, ice sheets, the atmosphere and soil moisture. The water cycle is essential to life on Earth and plays a large role in the global climate system and ocean circulation. The warming of our planet is expected to be accompanied by changes in the water cycle for various reasons. For example, a warmer atmosphere can contain more water vapor which has effects on evaporation and rainfall.
The Thornthwaite climate classification is a climate classification system created by American climatologist Charles Warren Thornthwaite in 1931 and modified in 1948.
The Standardized Precipitation Evapotranspiration Index (SPEI) is a multiscalar drought index based on climatic data. It was developed by Vicente-Serrano et al. (2010) at the Institute Pirenaico de Ecologia in Zaragoza, Spain. It can be used for determining the onset, duration and magnitude of drought conditions with respect to normal conditions in a variety of natural and managed systems such as crops, ecosystems, rivers, water resources, etc.


