In economics, a recession is a business cycle contraction that occurs when there is a period of broad decline in economic activity. Recessions generally occur when there is a widespread drop in spending. This may be triggered by various events, such as a financial crisis, an external trade shock, an adverse supply shock, the bursting of an economic bubble, or a large-scale anthropogenic or natural disaster. There is no official definition of a recession, according to the IMF.
A consumer confidence index (CCI) is an economic indicator published by various organizations in several countries.
An economic indicator is a statistic about an economic activity. Economic indicators allow analysis of economic performance and predictions of future performance. One application of economic indicators is the study of business cycles. Economic indicators include various indices, earnings reports, and economic summaries: for example, the unemployment rate, quits rate, housing starts, consumer price index, inverted yield curve, consumer leverage ratio, industrial production, bankruptcies, gross domestic product, broadband internet penetration, retail sales, price index, and changes in credit conditions.

Nonfarm payroll employment is a compiled name for goods, construction and manufacturing companies in the US. Approximately 80% of the workforce is accounted for nonfarm payrolls and it excludes farm workers, private household employees, actively serving military or non-profit organization employees. Approximately 131,000 businesses and government agencies, which amounts to around 670,000 worksites, are surveyed on a monthly basis.

The Federal Reserve Bank of Philadelphia — also known as the Philadelphia Fed or the Philly Fed — headquartered at 10 Independence Mall in Philadelphia, Pennsylvania, is responsible for the Third District of the Federal Reserve, which covers eastern and central Pennsylvania, the nine southern counties of New Jersey, and Delaware. Its geographical territory is by far the smallest in the system, and its population base is the second-smallest. The current president of the Philadelphia Fed is Patrick T. Harker.
Consumer confidence is an economic indicator that measures the degree of optimism that consumers feel about the overall state of the economy and their personal financial situation. If the consumer has confidence in the immediate and near future economy and his/her personal finance, then the consumer will spend more than save.
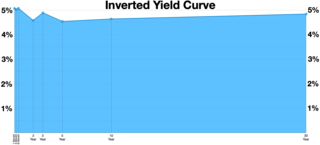
In finance, an inverted yield curve is a yield curve in which short-term debt instruments have a greater yield than longer term bonds. An inverted yield curve is an unusual phenomenon; bonds with shorter maturities generally provide lower yields than longer term bonds.

The University of Michigan Consumer Sentiment Index is a consumer confidence index published monthly by the University of Michigan. The index is normalized to have a value of 100 in the first quarter of 1966. Each month at least 500 telephone interviews are conducted of a contiguous United States sample. Fifty core questions are asked.
The Conference Board Leading Economic Index is an American economic leading indicator intended to forecast future economic activity. It is calculated by The Conference Board, a non-governmental organization, which determines the value of the index from the values of ten key variables. These variables have historically turned downward before a recession and upward before an expansion. The per cent change year over year of the Leading Economic Index is a lagging indicator of the market directions.
A soft landing in the business cycle is the process of an economy shifting from growth to slow-growth to potentially flat, as it approaches but avoids a recession. It is usually caused by government attempts to slow down inflation. The criteria for distinguishing between a hard and soft landing are numerous and subjective.
The Survey of Professional Forecasters (SPF) is a quarterly survey of macroeconomic forecasts for the economy of the United States issued by the Federal Reserve Bank of Philadelphia. It is the oldest such survey in the United States.
Stock market cycles are proposed patterns that proponents argue may exist in stock markets. Many such cycles have been proposed, such as tying stock market changes to political leadership, or fluctuations in commodity prices. Some stock market designs are universally recognized. However, many academics and professional investors are skeptical of any theory claiming to identify or predict stock market cycles precisely. Some sources argue identifying any such patterns as a "cycle" is a misnomer, because of their non-cyclical nature. Economists using efficient-market hypothesis say that asset prices reflect all available information meaning that it is impossible to systematically beat the market by taking advantage of such cycles.
An economic calendar is used by investors to monitor market-moving events, such as economic indicators and monetary policy decisions. Market-moving events, which are typically announced or released in a report, have a high probability of impacting the financial markets.
Economic Outlook is a twice-yearly analysis published by the Organisation for Economic Co-operation and Development (OECD) with economic analysis and forecasts for future economic performance of OECD countries. The main version is in English, and it is also published in French and German. The OECD also publishes Monthly Economic Indicators to complement the twice-yearly Economic Outlook.
The Livingston Survey is a biannual survey about the economy of the United States conducted by the Federal Reserve Bank of Philadelphia. Begun in 1946, it is the longest continuous record of economists' expectations.
The Asian Development Outlook is an annual publication produced by the Asian Development Bank (ADB). It offers economic analysis and forecasts, as well as an examination of social development issues, for most countries in Asia. It is published each March/April with an update published in September and brief supplements published in July and December. The publication is prepared by staff of ADB's regional departments, and field offices, under the coordination of the Economic Research and Regional Cooperation Department with the goal of developing "consistent forecasts for the region".
The Aruoba-Diebold-Scotti Business Conditions Index is a coincident business cycle indicator used in macroeconomics in the United States. The index measures business activity, which may be correlated with periods of expansion and contraction in the economy. The primary and novel function of the ADS index stems from its use of high-frequency economic data and subsequent high-frequency updating, opposed to the traditionally highly-lagged and infrequently-published macroeconomic data such as GDP.
In macroeconomics, the Sahm rule, or Sahm rule recession indicator, is a heuristic measure by the United States' Federal Reserve for determining when an economy has entered a recession. It is useful in real-time evaluation of the business cycle and relies on monthly unemployment data from the Bureau of Labor Statistics (BLS). It is named after economist Claudia Sahm, formerly of the Federal Reserve and Council of Economic Advisors.
