Price dispersion

Last updated

In economics, price dispersion is variation in prices across sellers of the same item, holding fixed the item's characteristics. Price dispersion can be viewed as a measure of trading frictions (or, tautologically, as a violation of the law of one price). It is often attributed to consumer search costs or unmeasured attributes (such as the reputation) of the retailing outlets involved. There is a difference between price dispersion and price discrimination. The latter concept involves a single provider charging different prices to different customers for an identical good. Price dispersion, on the other hand, is best thought of as the outcome of many firms potentially charging different prices, where customers of one firm find it difficult to patronize (or are perhaps unaware of) other firms due to the existence of search costs.

Economics Social science that analyzes the production, distribution, and consumption of goods and services

Economics is the social science that studies the production, distribution, and consumption of goods and services.

The law of one price (LOOP) states that in the absence of trade frictions, and under conditions of free competition and price flexibility, identical goods sold in different locations must sell for the same price when prices are expressed in a common currency. This law is derived from the assumption of the inevitable elimination of all arbitrage.

In microeconomics, search theory studies buyers or sellers who cannot instantly find a trading partner, and must therefore search for a partner prior to transacting.

Contents

Price dispersion measures include the range of prices, the percentage difference of highest and lowest price, the standard deviation of the price distribution, the variance of the price distribution, and the coefficient of variation of the price distribution.
Percentage Number or ratio as a fraction of 100

In mathematics, a percentage is a number or ratio expressed as a fraction of 100. It is often denoted using the percent sign, "%", or the abbreviations "pct.", "pct"; sometimes the abbreviation "pc" is also used. A percentage is a dimensionless number.

Standard deviation dispersion of the values of a random variable around its expected value

In statistics, the standard deviation is a measure that is used to quantify the amount of variation or dispersion of a set of data values. A low standard deviation indicates that the data points tend to be close to the mean of the set, while a high standard deviation indicates that the data points are spread out over a wider range of values.

Variance Statistical measure

In probability theory and statistics, variance is the expectation of the squared deviation of a random variable from its mean. Informally, it measures how far a set of (random) numbers are spread out from their average value. Variance has a central role in statistics, where some ideas that use it include descriptive statistics, statistical inference, hypothesis testing, goodness of fit, and Monte Carlo sampling. Variance is an important tool in the sciences, where statistical analysis of data is common. The variance is the square of the standard deviation, the second central moment of a distribution, and the covariance of the random variable with itself, and it is often represented by , , or .

In most theoretical literature, price dispersion is argued as result from spatial difference and the existence of significant search cost. With the development of internet and shopping agent programs, conventional wisdom tells that price dispersion should be alleviated and may eventually disappear in the online market due to the reduced search cost for both price and product features. However, recent studies found a surprisingly high level of price dispersion online, even for standardized items such as books, CDs and DVDs. There is some evidence of a shrinking of this online price dispersion, but it remains significant. Recently, work has also been done in the area of e-commerce, specifically the Semantic Web, and its effects on price dispersion.

Hal Varian, an economist at U. C. Berkeley, argued in a 1980 article that price dispersion may be an intentional marketing technique to encourage shoppers to explore their options. [1]

Hal Varian American economist

Hal Ronald Varian is an economist specializing in microeconomics and information economics. He is the chief economist at Google and he holds the title of emeritus professor at the University of California, Berkeley where he was founding dean of the School of Information.

A related concept is that of wage dispersion.

Consumer search and price dispersion

Search alone is insufficient

Even when consumers search, price dispersion is not guaranteed. Consumers may search, yet firms set the same price, negating the mere fact of searching. This is referred to as Diamond’s paradox. [2]

Assume that many firms provide a homogeneous good. Consumers will randomly sample only one firm if they expect that all firms charge the same price. Consequently, each firm has an equal share of consumers. Since consumers disregard the competitions, each firm acts as a monopoly on its share of consumers. Firms choose a price that maximizes profit: the monopoly price.

A necessary condition

A recurrent observation is that some consumers must sample one firm and only one, while the remaining consumers must sample at least two firms.

If all of them sample only one firm, then the market faces Diamond’s Paradox. Firms would ask the same price, and so there would be no price dispersion.

On the contrary, if all consumers sample at least two firms. The most expensive firm will not get any consumer, because consumers know at least another firm that is cheaper. As a result, prices must be as low as possible: equal to marginal costs of production, as in a Bertrand economy.

Price dispersion in a non-sequential search model

A non-sequential search strategy consists in choosing a number of prices to compare. If consumers follow a non-sequential search strategy, as long as some consumers sample only one firm, then an equilibrium in price dispersion exists. [3]

There is an equilibrium in price dispersion if some consumers search once, and the remaining consumers search more than one firm. Moreover, the distribution of prices has a closed form if consumers search at most two firms:

where ; with the share of consumer who sample only one firm, consumers' reservation price, and firms' marginal costs of production.

Such an equilibrium in price dispersion occurs when consumers minimize , with the sample size, a search cost, and the smallest price sampled.

Price dispersion in a sequential search model

A sequential search strategy consists in sampling prices one by one, and stop after identifying a sufficiently low price. In sequential search models, the existence of perfectly informed consumers guarantees the equilibrium in price dispersion if the remaining consumers search once and only one. There is a continuous relationship between the share of informed consumers and the type of competition: from Bertrand competition to Diamond competition as fewer and fewer consumers are initially perfectly informed. [4]

The distribution of price has a closed form:

on support ; where the share of perfectly informed consumers, the number of firms, the revenue function that attains its maximum in , consumers' reservation price, and

See also

Related Research Articles

In a chemical reaction, chemical equilibrium is the state in which both reactants and products are present in concentrations which have no further tendency to change with time, so that there is no observable change in the properties of the system. Usually, this state results when the forward reaction proceeds at the same rate as the reverse reaction. The reaction rates of the forward and backward reactions are generally not zero, but equal. Thus, there are no net changes in the concentrations of the reactant(s) and product(s). Such a state is known as dynamic equilibrium.

Normal distribution probability distribution

In probability theory, the normaldistribution is a very common continuous probability distribution. Normal distributions are important in statistics and are often used in the natural and social sciences to represent real-valued random variables whose distributions are not known. A random variable with a Gaussian distribution is said to be normally distributed and is called a normal deviate.

Skewness measure of the asymmetry of random variables

In probability theory and statistics, skewness is a measure of the asymmetry of the probability distribution of a real-valued random variable about its mean. The skewness value can be positive or negative, or undefined.

Multivariate normal distribution

In probability theory and statistics, the multivariate normal distribution, multivariate Gaussian distribution, or joint normal distribution is a generalization of the one-dimensional (univariate) normal distribution to higher dimensions. One definition is that a random vector is said to be k-variate normally distributed if every linear combination of its k components has a univariate normal distribution. Its importance derives mainly from the multivariate central limit theorem. The multivariate normal distribution is often used to describe, at least approximately, any set of (possibly) correlated real-valued random variables each of which clusters around a mean value.

In probability theory, Chebyshev's inequality guarantees that, for a wide class of probability distributions, no more than a certain fraction of values can be more than a certain distance from the mean. Specifically, no more than 1/k2 of the distribution's values can be more than k standard deviations away from the mean. The rule is often called Chebyshev's theorem, about the range of standard deviations around the mean, in statistics. The inequality has great utility because it can be applied to any probability distribution in which the mean and variance are defined. For example, it can be used to prove the weak law of large numbers.

In mathematics, a moment is a specific quantitative measure of the shape of a function. It is used in both mechanics and statistics. If the function represents physical density, then the zeroth moment is the total mass, the first moment divided by the total mass is the center of mass, and the second moment is the rotational inertia. If the function is a probability distribution, then the zeroth moment is the total probability, the first moment is the mean, the second central moment is the variance, the third standardized moment is the skewness, and the fourth standardized moment is the kurtosis. The mathematical concept is closely related to the concept of moment in physics.

Density of states a system describes the number of states per interval of energy at each energy level available to be occupied

In solid state physics and condensed matter physics, the density of states (DOS) of a system describes the number of states that are available to be occupied by the system at each level of energy. It is mathematically represented as a distribution by a probability density function, and it is generally an average over the space and time domains of the various states occupied by the system. The density of states is directly related to the dispersion relations of the properties of the system. High DOS at a specific energy level means that many states are available for occupation.

Variational Bayesian methods are a family of techniques for approximating intractable integrals arising in Bayesian inference and machine learning. They are typically used in complex statistical models consisting of observed variables as well as unknown parameters and latent variables, with various sorts of relationships among the three types of random variables, as might be described by a graphical model. As typical in Bayesian inference, the parameters and latent variables are grouped together as "unobserved variables". Variational Bayesian methods are primarily used for two purposes:

  1. To provide an analytical approximation to the posterior probability of the unobserved variables, in order to do statistical inference over these variables.
  2. To derive a lower bound for the marginal likelihood of the observed data. This is typically used for performing model selection, the general idea being that a higher marginal likelihood for a given model indicates a better fit of the data by that model and hence a greater probability that the model in question was the one that generated the data.

Cournot competition is an economic model used to describe an industry structure in which companies compete on the amount of output they will produce, which they decide on independently of each other and at the same time. It is named after Antoine Augustin Cournot (1801–1877) who was inspired by observing competition in a spring water duopoly. It has the following features:

Uniform distribution (continuous) uniform distribution on an interval

In probability theory and statistics, the continuous uniform distribution or rectangular distribution is a family of symmetric probability distributions such that for each member of the family, all intervals of the same length on the distribution's support are equally probable. The support is defined by the two parameters, a and b, which are its minimum and maximum values. The distribution is often abbreviated U(a,b). It is the maximum entropy probability distribution for a random variable X under no constraint other than that it is contained in the distribution's support.

Rice distribution probability distribution of the magnitude of a circular bivariate normal random variable

In probability theory, the Rice distribution, Rician distribution or Ricean distribution is the probability distribution of the magnitude of a circular bivariate normal random variable with potentially non-zero mean. It was named after Stephen O. Rice.

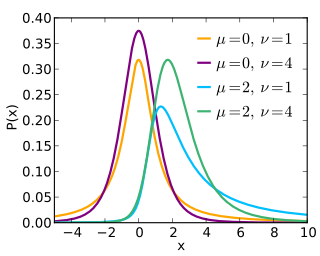
Noncentral <i>t</i>-distribution

As with other probability distributions with noncentrality parameters, the noncentral t-distribution generalizes a probability distribution – Student's t-distribution – using a noncentrality parameter. Whereas the central distribution describes how a test statistic t is distributed when the difference tested is null, the noncentral distribution describes how t is distributed when the null is false. This leads to its use in statistics, especially calculating statistical power. The noncentral t-distribution is also known as the singly noncentral t-distribution, and in addition to its primary use in statistical inference, is also used in robust modeling for data.

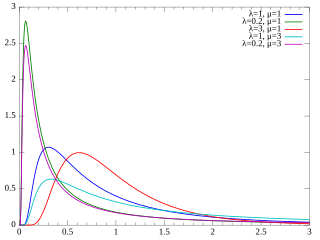
Inverse Gaussian distribution

In probability theory, the inverse Gaussian distribution is a two-parameter family of continuous probability distributions with support on (0,∞).

In directional statistics, the von Mises–Fisher distribution, is a probability distribution on the -dimensional sphere in . If the distribution reduces to the von Mises distribution on the circle.

In probability and statistics, the Tweedie distributions are a family of probability distributions which include the purely continuous normal and gamma distributions, the purely discrete scaled Poisson distribution, and the class of mixed compound Poisson–gamma distributions which have positive mass at zero, but are otherwise continuous. For any random variable Y that obeys a Tweedie distribution, the variance var(Y) relates to the mean E(Y) by the power law,

Wrapped normal distribution

In probability theory and directional statistics, a wrapped normal distribution is a wrapped probability distribution that results from the "wrapping" of the normal distribution around the unit circle. It finds application in the theory of Brownian motion and is a solution to the heat equation for periodic boundary conditions. It is closely approximated by the von Mises distribution, which, due to its mathematical simplicity and tractability, is the most commonly used distribution in directional statistics.

In statistics and probability theory, the nonparametric skew is a statistic occasionally used with random variables that take real values. It is a measure of the skewness of a random variable's distribution—that is, the distribution's tendency to "lean" to one side or the other of the mean. Its calculation does not require any knowledge of the form of the underlying distribution—hence the name nonparametric. It has some desirable properties: it is zero for any symmetric distribution; it is unaffected by a scale shift; and it reveals either left- or right-skewness equally well. Although its use has been mentioned in older textbooks it appears to have gone out of fashion. In statistical samples it has been shown to be less powerful than the usual measures of skewness in detecting departures of the population from normality.

In statistics, the multivariate Behrens–Fisher problem is the problem of testing for the equality of means from two multivariate normal distributions when the covariance matrices are unknown and possibly not equal. Since this is a generalization of the univariate Behrens-Fisher problem, it inherits all of the difficulties that arise in the univariate problem.

References

  1. Varian, H. R. (1980). A model of sales. The American Economic Review, 70(4), 651-659.
  2. Diamond, P. A. (1971). A model of price adjustment. Journal of economic theory, 3(2), 156-168.
  3. Burdett, K., & Judd, K. L. (1983). Equilibrium price dispersion. Econometrica: Journal of the Econometric Society, 955-969.
  4. Stahl, D. O. (1989). Oligopolistic pricing with sequential consumer search. The American Economic Review, 700-712.