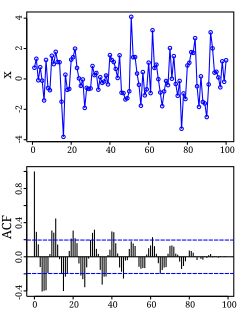
Autocorrelation, also known as serial correlation, is the correlation of a signal with a delayed copy of itself as a function of delay. Informally, it is the similarity between observations as a function of the time lag between them. The analysis of autocorrelation is a mathematical tool for finding repeating patterns, such as the presence of a periodic signal obscured by noise, or identifying the missing fundamental frequency in a signal implied by its harmonic frequencies. It is often used in signal processing for analyzing functions or series of values, such as time domain signals.

In probability theory and statistics, variance is the expectation of the squared deviation of a random variable from its mean. In other words, it measures how far a set of numbers is spread out from their average value. Variance has a central role in statistics, where some ideas that use it include descriptive statistics, statistical inference, hypothesis testing, goodness of fit, and Monte Carlo sampling. Variance is an important tool in the sciences, where statistical analysis of data is common. The variance is the square of the standard deviation, the second central moment of a distribution, and the covariance of the random variable with itself, and it is often represented by , , or .
In probability, and statistics, a multivariate random variable or random vector is a list of mathematical variables each of whose value is unknown, either because the value has not yet occurred or because there is imperfect knowledge of its value. The individual variables in a random vector are grouped together because they are all part of a single mathematical system — often they represent different properties of an individual statistical unit. For example, while a given person has a specific age, height and weight, the representation of these features of an unspecified person from within a group would be a random vector. Normally each element of a random vector is a real number.

In probability theory and statistics, the multivariate normal distribution, multivariate Gaussian distribution, or joint normal distribution is a generalization of the one-dimensional (univariate) normal distribution to higher dimensions. One definition is that a random vector is said to be k-variate normally distributed if every linear combination of its k components has a univariate normal distribution. Its importance derives mainly from the multivariate central limit theorem. The multivariate normal distribution is often used to describe, at least approximately, any set of (possibly) correlated real-valued random variables each of which clusters around a mean value.

In statistics, correlation or dependence is any statistical relationship, whether causal or not, between two random variables or bivariate data. In the broadest sense correlation is any statistical association, though it commonly refers to the degree to which a pair of variables are linearly related. Familiar examples of dependent phenomena include the correlation between the height of parents and their offspring, and the correlation between the price of a good and the quantity the consumers are willing to purchase, as it is depicted in the so-called demand curve.
In probability theory and statistics, covariance is a measure of the joint variability of two random variables. If the greater values of one variable mainly correspond with the greater values of the other variable, and the same holds for the lesser values, the covariance is positive. In the opposite case, when the greater values of one variable mainly correspond to the lesser values of the other,, the covariance is negative. The sign of the covariance therefore shows the tendency in the linear relationship between the variables. The magnitude of the covariance is not easy to interpret because it is not normalized and hence depends on the magnitudes of the variables. The normalized version of the covariance, the correlation coefficient, however, shows by its magnitude the strength of the linear relation.

In probability theory and statistics, a covariance matrix is a square matrix giving the covariance between each pair of elements of a given random vector. Any covariance matrix is symmetric and positive semi-definite and its main diagonal contains variances.

In statistics, the Pearson correlation coefficient, also referred to as Pearson's r, the Pearson product-moment correlation coefficient (PPMCC), or the bivariate correlation, is a measure of linear correlation between two sets of data. It is the covariance of two variables, divided by the product of their standard deviations; thus it is essentially a normalised measurement of the covariance, such that the result always has a value between −1 and 1. As with covariance itself, the measure can only reflect a linear correlation of variables, and ignores many other types of relationship or correlation. As a simple example, one would expect the age and height of a sample of teenagers from a high school to have a Pearson correlation coefficient significantly greater than 0, but less than 1.
In probability theory and statistics, a Gaussian process is a stochastic process, such that every finite collection of those random variables has a multivariate normal distribution, i.e. every finite linear combination of them is normally distributed. The distribution of a Gaussian process is the joint distribution of all those random variables, and as such, it is a distribution over functions with a continuous domain, e.g. time or space.

In statistics, canonical-correlation analysis (CCA), also called canonical variates analysis, is a way of inferring information from cross-covariance matrices. If we have two vectors X = (X1, ..., Xn) and Y = (Y1, ..., Ym) of random variables, and there are correlations among the variables, then canonical-correlation analysis will find linear combinations of X and Y which have maximum correlation with each other. T. R. Knapp notes that "virtually all of the commonly encountered parametric tests of significance can be treated as special cases of canonical-correlation analysis, which is the general procedure for investigating the relationships between two sets of variables." The method was first introduced by Harold Hotelling in 1936, although in the context of angles between flats the mathematical concept was published by Jordan in 1875.
In statistics, propagation of uncertainty is the effect of variables' uncertainties on the uncertainty of a function based on them. When the variables are the values of experimental measurements they have uncertainties due to measurement limitations which propagate due to the combination of variables in the function.
In mathematical statistics, the Fisher information is a way of measuring the amount of information that an observable random variable X carries about an unknown parameter θ of a distribution that models X. Formally, it is the variance of the score, or the expected value of the observed information. In Bayesian statistics, the asymptotic distribution of the posterior mode depends on the Fisher information and not on the prior. The role of the Fisher information in the asymptotic theory of maximum-likelihood estimation was emphasized by the statistician Ronald Fisher. The Fisher information is also used in the calculation of the Jeffreys prior, which is used in Bayesian statistics.

In signal processing, cross-correlation is a measure of similarity of two series as a function of the displacement of one relative to the other. This is also known as a sliding dot product or sliding inner-product. It is commonly used for searching a long signal for a shorter, known feature. It has applications in pattern recognition, single particle analysis, electron tomography, averaging, cryptanalysis, and neurophysiology. The cross-correlation is similar in nature to the convolution of two functions. In an autocorrelation, which is the cross-correlation of a signal with itself, there will always be a peak at a lag of zero, and its size will be the signal energy.
In statistics, sometimes the covariance matrix of a multivariate random variable is not known but has to be estimated. Estimation of covariance matrices then deals with the question of how to approximate the actual covariance matrix on the basis of a sample from the multivariate distribution. Simple cases, where observations are complete, can be dealt with by using the sample covariance matrix. The sample covariance matrix (SCM) is an unbiased and efficient estimator of the covariance matrix if the space of covariance matrices is viewed as an extrinsic convex cone in Rp×p; however, measured using the intrinsic geometry of positive-definite matrices, the SCM is a biased and inefficient estimator. In addition, if the random variable has normal distribution, the sample covariance matrix has Wishart distribution and a slightly differently scaled version of it is the maximum likelihood estimate. Cases involving missing data require deeper considerations. Another issue is the robustness to outliers, to which sample covariance matrices are highly sensitive.
In statistics and signal processing, a minimum mean square error (MMSE) estimator is an estimation method which minimizes the mean square error (MSE), which is a common measure of estimator quality, of the fitted values of a dependent variable. In the Bayesian setting, the term MMSE more specifically refers to estimation with quadratic loss function. In such case, the MMSE estimator is given by the posterior mean of the parameter to be estimated. Since the posterior mean is cumbersome to calculate, the form of the MMSE estimator is usually constrained to be within a certain class of functions. Linear MMSE estimators are a popular choice since they are easy to use, easy to calculate, and very versatile. It has given rise to many popular estimators such as the Wiener–Kolmogorov filter and Kalman filter.
In probability theory and statistics, the mathematical concepts of covariance and correlation are very similar. Both describe the degree to which two random variables or sets of random variables tend to deviate from their expected values in similar ways.
In multivariate statistics, if is a vector of random variables, and is an -dimensional symmetric matrix, then the scalar quantity is known as a quadratic form in .
A whitening transformation or sphering transformation is a linear transformation that transforms a vector of random variables with a known covariance matrix into a set of new variables whose covariance is the identity matrix, meaning that they are uncorrelated and each have variance 1. The transformation is called "whitening" because it changes the input vector into a white noise vector.

In statistics and in probability theory, distance correlation or distance covariance is a measure of dependence between two paired random vectors of arbitrary, not necessarily equal, dimension. The population distance correlation coefficient is zero if and only if the random vectors are independent. Thus, distance correlation measures both linear and nonlinear association between two random variables or random vectors. This is in contrast to Pearson's correlation, which can only detect linear association between two random variables.
In statistics, functional correlation is a dimensionality reduction technique used to quantify the correlation and dependence between two variables when the data is functional. Several approaches have been developed to quantify the relation between two functional variables.


